Graphical Animation of for
loop
To demonstrate the operation of the for statement, lets
consider a series of animations.
The code we will be using is
	#include <stdio.h>

	main() {
		int x, y, z;

		x = 2;
		y = 2;
		z = 3;

		for( x = 1; x <= 6; x = x + 1 ) {
			printf("%d", y );
			y = y + 1;
		}
		printf("\n%d", z );
	}


	Sample Program Output
	2 3 4 5 6 7
	3
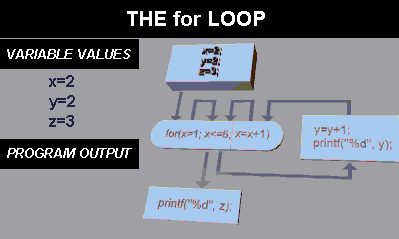
The following diagram shows the initial state of the program, after the initialization of the variables x, y, and z.
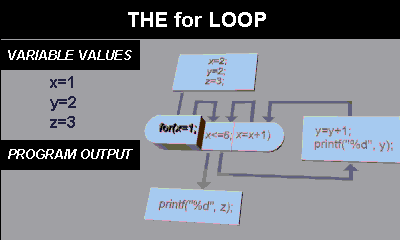
On entry to the for statement, the first expression is executed, which in our example assigns the value 1 to x. This can be seen in the graphic shown below (Note: see the Variable Values: section)
The next part of the for is executed, which tests the value of the loop variable x against the constant 6.
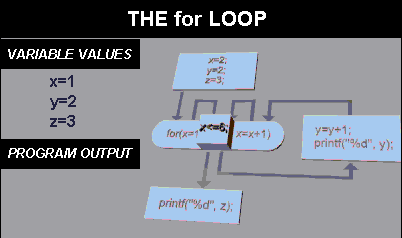
It can be seen from the variable window that x has a current value of 1, so the test is successful, and program flow branches to execute the statements of the for body, which prints out the value of y, then adds 1 to y. You can see the program output and the state of the variables shown in the graphic below.
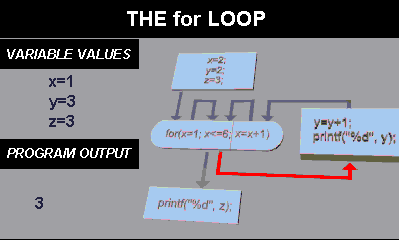
After executing the statements of the for body, execution returns to the last part of the for statement. Here, the value of x is incremented by 1. This is seen by the value of x changing to 2.
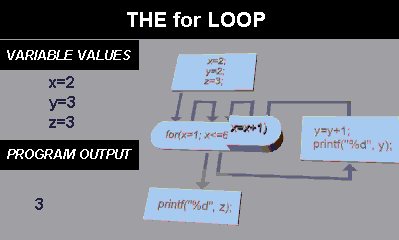
Next, the condition of the for variable is tested again. It continues because the value of it (2) is less than 6, so the body of the loop is executed again.
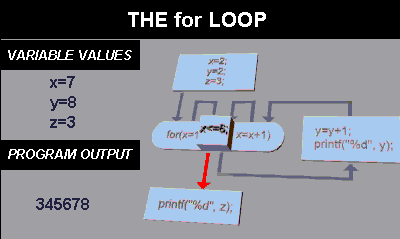
Execution continues till the value of x reaches 7. Lets now jump ahead in the animation to see this. Here, the condition test will fail, and the for statement finishes, passing control to the statement which follows.
Play "for" animation [AVI, 4.4MB, CD-ROM
only]
Play "for" animation [Real Video, 740KB, CD-ROM
only]