
Other Weekly Reports
Admissions Weekly Applications - Global Campus Weekly Enrollment - Graduate Studies Weekly Enrollment
Overall university-wide reporting typically follows two main cycles per academic year:
- Approaching Fall shown through weeks 14-36 of the calendar year
- Approaching Winter shown from week 40 of the end of a calendar year through week 5 of the beginning of the next year.
There is no enrollment reporting for weeks 6-13 or 37-40.
Reporting on this page covers all segments of NMU enrollment including Global Campus and Graduate students unless otherwise specified in the report.
IE Weekly Report - 7.12.24
IE Weekly Report - 7.12.24
*Note, figures displayed below include Global Campus counts unless otherwise noted.
Happy Friday All,
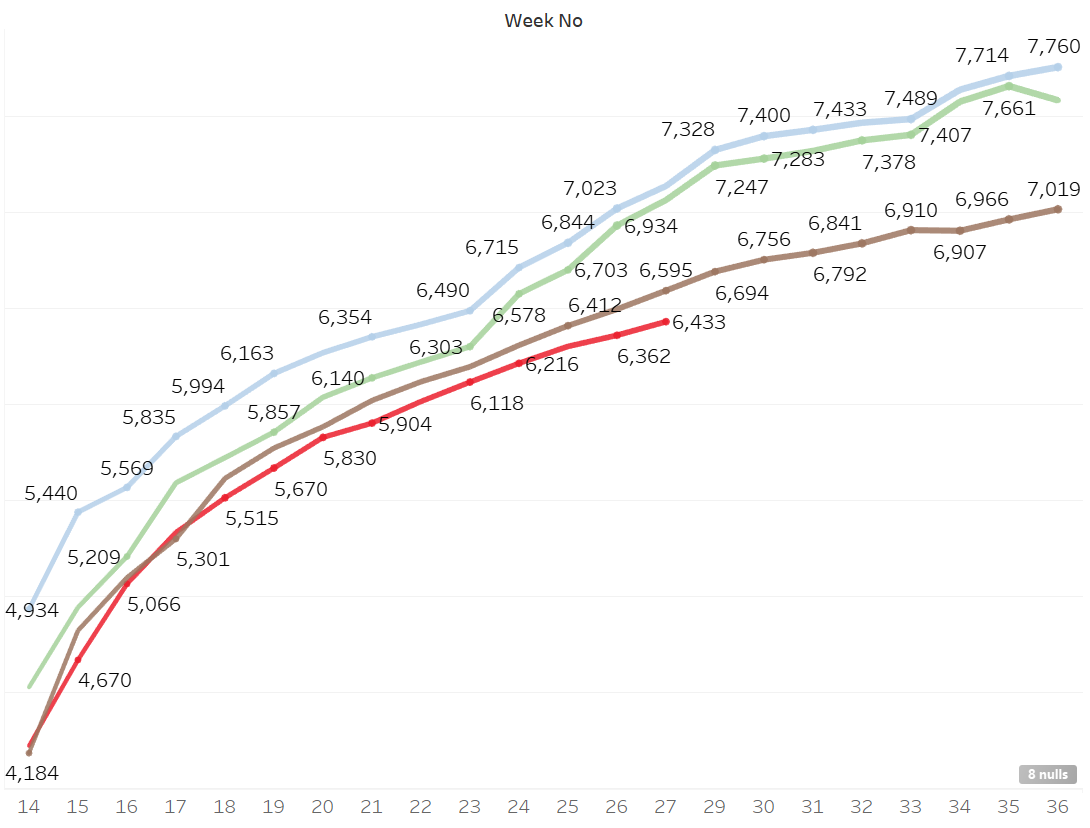
Now that we are through orientation, I thought it'd be a good time for a thorough update on enrollment and persistence. This year, in particular, several things have changed our ability to accurately predict enrollment, which is why the updates you may be used to receiving from IE have been more sporadic. The major factors include implementation of the Common App, FAFSA delays, changes to how new first-time freshmen are scheduled into classes before and during orientation, as well as changes in how and when students fully commit. These changes have led to a trend that looks like no year before (even during COVID-19 like in 2020 below). You can see all of this in the yellow line below which is our current march towards Fall 2024.


New First-time Freshmen, weeks 13-37, currently yellow line week 29
These inconsistencies are starting to settle out and we are beginning to gain clarity in what our Fall 2024 enrollment will look like. You can look at the specific student segments below, but in nearly every category, we are seeing positive gains. In particular, New First-time Freshmen (likely to still continue to grow over last year), New Transfers, UG Continuing, New Grad, and Continuing Grad are all in strong positions. While we still have a ways to go, and other factors will likely still impact the final fall census, but as of today, the overall enrollment picture is shaping up nicely.
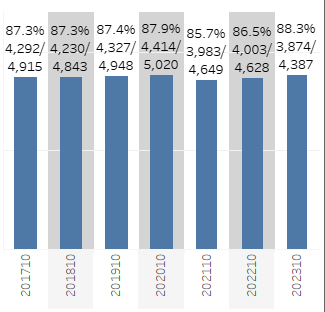
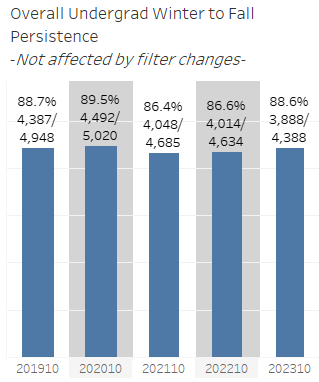
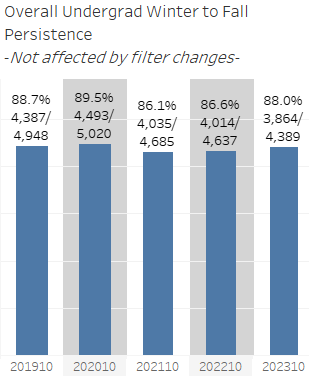
Another key area relates to persistence. Recall that we have been tracking "unfinished business" for the last two years. These students were attending classes when the Winter 2024 10th day census was created but didn't graduate in Winter 2024 (or get suspended). They should be continuing their education. We check, once fall course registration opens, to see who has registered or not. The students who should be re-enrolling but haven't signed up for classes are identified and lists are distributed to the student success team and academic departments. Of note, Global Campus students are on different annual cycles than our traditional on-campus students and are excluded from the data view below but have their own outreach efforts in place. Currently, Winter-to-Fall re-enrollment is up +1.0pts over last year (+40 more students retained) and up +3.8pts (+160 more retained) over the recent low in 2021.

Overall On-Campus re-enrollment as of week 29
In particular, these gains are being seen in Baccalaureate Freshman (+6.7pts) and Sophomore (+3.6pts) class students. This semester-to-semester outreach, along with other efforts, is showing an impact and our year-over-year persistence continues to grow and has now outpaced our highwater marks of the past and most certainly is contributing to the strong UG Continuing enrollment counts from above. This also indicates an improvement in our retention rate is likely this fall.

While this year has been like none other before it in terms of predicting fall enrollment, the picture is becoming clearer and providing optimism that we'll be in a strong position come 10th-day, close of business September 6th, when the data is captured.
A closer look at Fall 2024:
Undergraduate headcount compared to this week last fall:
• New Freshmen: +1.5% (+23, n=1,526)
• New Transfer: +8.4% (+20, n=258)
• Undergrad Readmits: +10.2% (+6, n=65)
• Postbaccalaureate: -18.0% (-9, n=41)
• Postbaccalaureate Reentry: +300.0% (+3, n=4)
• Undergrad Nondegree: +8.6% (+6, n=76)
• Continuing Undergrad: +2.7% (+115, n=4,302)
• Undergraduate - Total: +2.7% (+164, n=6,272)
Graduate headcount:
• New Graduate: +37.3% (+38, n=140)
• Readmitted Grad: -25.0% (-2, n=6)
• Continuing Grad: +34.0% (+115, n=453)
• Graduate - Total: +33.7% (+151, n=599)
Overall headcount:
• Overall - Total Headcount: +4.8% (+315, n=6,871)
Student Credit Hours:
• Overall Student Credit Hours: +1.0% (+891.5, n=88,052.5)
Full-time Equivalent Students (FTE):
For FTE calcs, UG credit hours divide by 15 and graduate credit hours divided by 12
• Undergraduate FTE: +0.1% (+5.4, n=5,612.3)
• Graduate FTE: +26.5% (+67.6, n=322.4)
• Overall FTE: +1.2% (+73.0, n=5,934.6)
This report will also be posted on our Weekly Enrollment Reporting (SSO required) section of the IE website where you can also find reports from our colleagues from Grad Studies, Admissions, and Global Campus.
Comparative Enrollment & Cr Hrs by Student Category - Summer 2024
Comparative Enrollment & Cr Hrs by Student Category - Fall 2024
Thank you,
Jason Nicholas
Assistant Provost and Director for Institutional Effectiveness
Northern Michigan University
1401 Presque Isle Ave
Marquette, MI 49855-5301
906-227-2379
nmu.edu/ie
IE Weekly Report - 1.12.24
IE Weekly Report - 1.12.24
*Note, figures displayed below include Global Campus counts unless otherwise noted.
Happy New Year!
Winter 10th-day reports will be released starting January 30th, 2024. As always, this is a smaller portfolio of reports compared to fall. If you would like additional analyses, feel free to reach out to the IE team to discuss.
All indicators continue to point toward a strong Winter semester. Enrollment is up over this time last year approaching winter. While the counts are much smaller this time of year, New First-time Freshmen, New Transfers, Readmits, and Postbaccalaureate undergraduate segments are all running ahead. The largest population, UG Continuing, is up +4.8% (+273, n=5,967) compared to last winter. Graduate student populations are also seeing strong signs with New Graduate up +102.6% (+40, n=79) and Grad Continuing up +20.6% (+126, n=604). These groups combined are leading to an overall headcount increase of +6.5% (+399, N=6,571) with student credit hours up +5.8% (+4,566.5, N=83,736) and overall FTE at +6.0% (+317.9, N= 5,645.5).
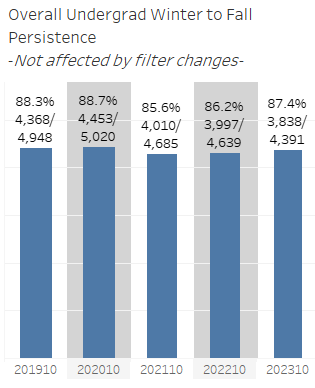
Our re-enrollment of students with "unfinished business" continues to also trend higher than previous years.

While an increase of 1.4% may not seem like much, increases over the low point of 2020 (88.3%) are very important. Remember, these are the students who should be coming back. They have unfinished business and need to register to continue progress toward their degree. Importantly, most of our increases are being seen in the sophomore, and more importantly, the freshmen populations.
For example, an increase of 1.4% over 2022 means an additional +80 students, across all undergraduate classes, have re-enrolled. Had our 2020 rate of 88.3% held steady there'd be about -230 fewer students than today.
These re-enrollment rates give us optimism that we'll see increases in our fall-to-fall retention rates which improved again in Fall 2023 (75.8%) but still have the opportunity to improve further. Increases in winter enrollment, re-enrollment of unfinished business students, and improving retention rates are all reasons to be optimistic about future stability in overall enrollment counts. A nice change after many years of dreading the demographic cliff and enrollment declines. We are not out of the woods yet, but for now, the numbers are in our favor.
A closer look:
Undergraduate headcount compared to this week last fall:
• New Freshmen: +13.7% (+7, n=58)
• New Transfer: +36.1% (+30, n=113)
• Undergrad Readmits: +19.2% (+10, n=62)
• Postbaccalaureate: +36.2% (+17, n=64)
• Postbaccalaureate Reentry: -66.7% (-2, n=1)
• Undergrad Nondegree: -18.2% (-14, n=63)
• Continuing Undergrad: +4.2% (+225, n=5,606)
• Undergraduate - Total: +4.8% (+273, n=5,967)
Graduate headcount:
• New Graduate: +102.6% (+40, n=79)
• Readmitted Grad: 0.0% (0, n=21)
• Continuing Grad: +20.6% (+86, n=504)
• Graduate - Total: +26.4% (+126, n=604)
Overall headcount:
• Overall - Total Headcount: +6.5% (+399, n=6,571)
Student Credit Hours:
• Overall Student Credit Hours: +5.8% (+4,566.5, n=83,736)
Full-time Equivalent Students (FTE):
For FTE calcs, UG credit hours divide by 15 and graduate credit hours divided by 12
• Undergraduate FTE: +4.9% (+250.5, n=5,330.2)
• Graduate FTE: +27.2% (+67.4, n=315.3)
• Overall FTE: +6.0% (+317.9, n=5,645.5)
Comparative Enrollment & Cr Hrs by Student Category - Winter 2024
Thank you,
Jason Nicholas
Assistant Provost and Director for Institutional Effectiveness
Northern Michigan University
1401 Presque Isle Ave
Marquette, MI 49855-5301
906-227-2379
nmu.edu/ie
IE Weekly Report - 12.8.23
IE Weekly Report - 12.8.23
*Note, figures displayed below include Global Campus counts unless otherwise noted.
Undergraduate headcount compared to this week last fall:
• New Freshmen: +35.5% (+11, n=42)
• New Transfer: +36.4% (+20, n=75)
• Undergrad Readmits: +10.0% (+4, n=44)
• Postbaccalaureate: +41.7% (+15, n=51)
• Postbaccalaureate Reentry: -50.0% (-1, n=1)
• Undergrad Nondegree: +30.8% (+12, n=51)
• Pre-Banner: N/A (+1, n=1)
• Continuing Undergrad: +5.3% (+272, n=5,406)
• Undergraduate - Total: +6.2% (+333, n=5,670)
Graduate headcount:
• New Graduate: +10.7% (+3, n=31)
• Readmitted Grad: +9.1% (+1, n=12)
• Continuing Grad: +23.5% (+84, n=441)
• Graduate - Total: +22.2% (+88, n=484)
Overall headcount:
• Overall - Total Headcount: +7.3% (+421, n=6,154)
Student Credit Hours:
• Overall Student Credit Hours: +5.1% (+3,852, n=78,781.5)
Full-time Equivalent Students (FTE):
For FTE calcs, UG credit hours divide by 15 and graduate credit hours divided by 12
• Undergraduate FTE: 4.7% (224.5, n=5051.3)
• Graduate FTE: 19.2% (40.4, n=251.0)
• Overall FTE: 5.3% (264.9, n=5302.3)
Comparative Enrollment & Cr Hrs by Student Category - Winter 2024
Thank you,
Jason Nicholas
Assistant Provost and Director for Institutional Effectiveness
Northern Michigan University
1401 Presque Isle Ave
Marquette, MI 49855-5301
906-227-2379
nmu.edu/ie
IE Weekly Report - 12.1.23
IE Weekly Report - 12.1.23
*Note, figures displayed below include Global Campus counts unless otherwise noted.
As we near the end of the Fall 2023 semester, and now are a couple of weeks into winter registration, enrollment data has stabilized and now is a good time for an update on where we expect to be for Winter 2024.
A peek at our "unfinished business" bachelor and associate degree-seeking student re-enrollment rates shows that, of those who should be returning next semester (those graduating or dismissed excluded), 88.8% are registered for Winter 2024.
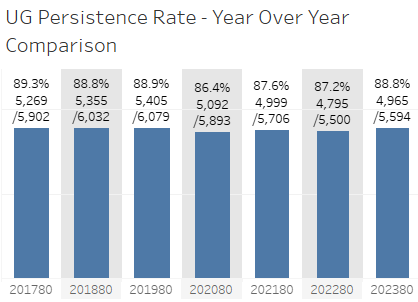
To better describe the impact of this improvement, if we had continued with our 2020 rates, we would have about 130 fewer students registered today. We would only be up for this coming Winter by +3.5% instead of +5.9%. Improvements in these persistence rates also stack up and if we'd have stayed at that recent low of 86.4% seen in 2020 across the last 3 years, we'd have 242 fewer students and only be up +1.5%. Stacking improved persistence rates is key to stabilizing enrollment and improving student outcome measures like retention and completion.
As for overall enrollment for Winter 2024, UG continuing counts make up 96% of winter semester UG enrollment (89% of overall enrollment) with only a few dozen new freshmen and new transfers starting in the winter. Continuing UG counts continue to run in the green currently up +4.3% (+232, n=5,447), but remember, this segment is a reflection of both outgoing graduating students, the size of the fall incoming freshmen class, and persistence rates in all other classes. This is more than just a count of students persisting from fall to winter which is why we typically focus on the "unfinished business" story as the best way to gauge returning behavior. Overall, we appear to be setting up for a strong winter enrollment.
A closer look at Winter 2024:
Undergraduate headcount compared to this week last fall:
• New Freshmen: -64.5% (-20, n=11)
• New Transfer: +18.4% (+9, n=58)
• Undergrad Readmits: +11.4% (+4, n=39)
• Postbaccalaureate: +55.2% (+16, n=45)
• Postbaccalaureate Reentry: -50.0% (-1, n=1)
• Undergrad Nondegree: +28.6% (+10, n=45)
• Continuing Undergrad: +4.3% (+214, n=5,248)
• Undergraduate - Total: +4.4% (+232, n=5,447)
Graduate headcount:
• New Graduate: +12.0% (+3, n=28)
• Readmitted Grad: +20.0% (+2, n=12)
• Continuing Grad: +27.7% (+91, n=420)
• Graduate - Total: +26.4% (+96, n=460)
Overall headcount:
• Overall - Total Headcount: +5.9% (+328, n=5907)
Student Credit Hours:
• Overall Student Credit Hours: +4.3% (3,117.5, n=76,055)
Full-time Equivalent Students (FTE):
For FTE calcs, UG credit hours divide by 15 and graduate credit hours divided by 12
• Undergraduate FTE: +3.6% (171.2, n=4,877.0)
• Graduate FTE: +23.4% (45.8, n=241.6)
• Overall FTE: +4.4% (217.0, n=5,118.7)
Comparative Enrollment & Cr Hrs by Student Category - Winter 2024
Thank you,
Jason Nicholas
Assistant Provost and Director for Institutional Effectiveness
Northern Michigan University
1401 Presque Isle Ave
Marquette, MI 49855-5301
906-227-2379
nmu.edu/ie
IE Weekly Report - 9.1.23
IE Weekly Report - 9.1.23
*Note, figures displayed below include Global Campus counts unless otherwise noted.
Congratulations to all on making it through the first week of classes! This will be the final message about weekly fall enrollment for this year's fall cycle. Reports for the winter cycle will resume in November once registration is open. Our annual 10th day fall census will be snapped on Monday, September 11th at the end of the business day. On Tuesday, September 12th, the IE team will begin breaking down numbers and sharing reports through our usual channels. If you haven't gotten 10th day reports in the past, but would be interested in receiving them, please email me (janichol@nmu.edu).
I won't go into too much detail about this week's current counts, other than to say, if you notice in row 17 of the linked report below, you'll see a current count of 44 "Withdrawal Pending" students. These are students who have indicated they are withdrawing from NMU but their paperwork hasn't been processed completely. So, we'll likely see some reduction in the overall +3.5% headcount gains (+247, n=7266) between now and 10th day. Nothing to be alarmed about and very normal for this time of year, but a part of the story to be aware of.
A closer look at Fall 2023:
Undergraduate headcount compared to this week last fall:
• New Freshmen: +9.6% (+137, n=1,568)
• New Transfer: +14.9% (+59, n=456)
• Undergrad Readmits: -13.0% (-16, n=107)
• Postbaccalaureate: +14.7% (+10, n=78)
• Postbaccalaureate Reentry: -25.0% (-1, n=3)
• Undergrad Nondegree: +40.2% (+35, n=122)
• Continuing Undergrad: -1.4% (-60, n=4304)
• Undergraduate - Total: +2.5% (+165, n=6,639)
Graduate headcount:
• New Graduate: +36.6% (+56, n=209)
• Readmitted Grad: +25.0% (+5, n=25)
• Continuing Grad: +5.6% (+21, n=393)
• Graduate - Total: +15.0% (+82, n=627)
Overall headcount:
• Overall - Total Headcount: +3.5% (+247, n=7,266)
Student Credit Hours:
• Overall Student Credit Hours: +2.2% (+2,024, n=93,789.5)
Full-time Equivalent Students (FTE):
For FTE calcs, UG credit hours divide by 15 and graduate credit hours divided by 12
• Undergraduate FTE: +1.6% (+95.6, n=5,991.9)
• Graduate FTE: +17.7% (+49.1, n=326.0)
• Overall FTE: +2.3% (+144.8, n=6,317.8)
Comparative Enrollment & Cr Hrs by Student Category - Fall 2023
IE Weekly Report - Fall 2023 1st Day Preliminary Counts
The following is an update on preliminary numbers as of the end of the day yesterday (1st day).
Highlights:
New First-time Freshmen are currently up +10.0% (+142, n=1,569). New First-time Transfers are up +14.5% (+57, n=450). Continuing UG are down -1.4% (-61, n=4,291). Overall Undergraduates are at +2.4% (+153, n=6,603). We had another large graduating class in AY 22-23. This creates a deficit in our UG Continuing counts so, while this segment is down, retention and persistence are still likely to be up at 10th-day.
New first-time grads are currently up +30.3% (+46, n=198) with Grad Continuing also up +7.1% (+26, n=390). Overall Graduate counts are at +13.8% (+74, n=611).
Global Campus counts also show increases with Overall Headcount up +45.7% (+250, n=797).
All of this together puts us at +3.2% (+227, N=7,214) overall for headcount, +2.1% (+1,949, N=93,609) for SCH, and +2.3% (+139, N=6,305) for FTE.
Last year, we lost -17 students between 1st day and 10th day. However, in the 3 years before last year, we lost closer to -50 students between 1st day and 10th day. We will continue to see some movement in the numbers before we snap the census. The 10th-day census snap will occur at the close of business on September 11th, 2023.
A closer look:
Undergraduate headcount compared to 1st day last fall:
· New First-time Freshmen: +10.0% (+142, n=1,569)
· New Transfers: +14.5% (+57, n=450)
· Undergrad Readmits: -13.1% (-16, n=106)
· Continuing UG: -1.4% (-61, n=4,291)
· Overall UG: +2.4% (+153, n=6,603)
Graduate headcount compared to 1st day last fall:
· New first-time grads: +30.3% (+46, n=198)
· Readmit grads: +9.5% (+2, n=23)
· Continuing grads: +7.1% (+26, n=390)
· Overall Grad: +13.8% (+74, n=611)
Global Campus compared to 1st day last fall:
· Overall Headcount, +45.7%, (+250, n=797)
· Overall SCH: +54.9% (+2,122, n=5,990)
· Overall FTE: +53.1%, (+150, n=433)
Overall headcount compared to 1st day last fall:
· Overall Headcount: +3.2% (+227, N=7,214)
Student Credit Hours compared to 1st day last fall:
· +2.1% (+1,949, N=93,609)
Full-time Equivalent Students (FTE) compared to 1st day last fall:
For FTE calcs, UG credit hours divide by 15 and graduate credit hours divided by 12
· Undergraduate FTE: +1.6% (+94, n=5,985)
· Graduate FTE: +16.5% (+45, n=320)
· Overall FTE: +2.3% (+139, N=6,305)
A big thank you to Katie Schoonveld for helping pull these figures together this morning.
IE Weekly Report - 8.25.23
IE Weekly Report - 8.25.23
*Note, figures displayed below include Global Campus counts unless otherwise noted.
This week's report will be shared on Tuesday (9/5/23) after preliminary first-day counts become available. For those who might be curious to see this week's regular counts, you can find that sheet at the link below.
Comparative Enrollment & Cr Hrs by Student Category - Fall 2023
IE Weekly Report - 8.18.23
IE Weekly Report - 8.18.23
*Note, figures displayed below include Global Campus counts unless otherwise noted.
Well, we are in the home stretch for Fall 2023 enrollment. The first day of classes will be August 28th (and we'll snap preliminary counts then) with the 10th-day official census on September 11th. IE census reporting will begin on September 12th with our usual portfolio of reports distributed over a couple of days.
The overall counts have changed quite a bit in the last couple of weeks driven primarily by two main reasons. First, two weeks ago, a large number of non-degree registrations took place for our community members who enjoy Senior Swim and Senior Exercise classes. These increases raised our headcount but didn't move our credit hours by that much. Today's increases, though, impact both counts and credits. This week, over 250 new Global Campus students were admitted as part of the Talent Together (TT) and Grow Your Own (GYO) initiatives for teacher prep in Michigan. All the TT and GYO students are enrolled in NMU programs offered through the School of Education, Leadership, and Public Service (SELPS). There may be additional enrollment over the next couple of weeks through these programs as well. The TT and GYO participants will be with NMU for at least two years as they work through their programs.
These are sizable increases and have shifted our enrollment landscape considerably. I encourage you to review the "A closer look at Fall 2023" section below as most segments have moved in positive directions due to these programs. Overall, we are now +182 students more than last year pushing us back over 7K in total enrollment (N=7,089, +2.6%). Importantly, as well, SCH increased by +1,925 to 92,233, which is +2.1% more than last year. (Thanks to Brad Hamel for the descriptions about the TT and GYO programs and impacts).
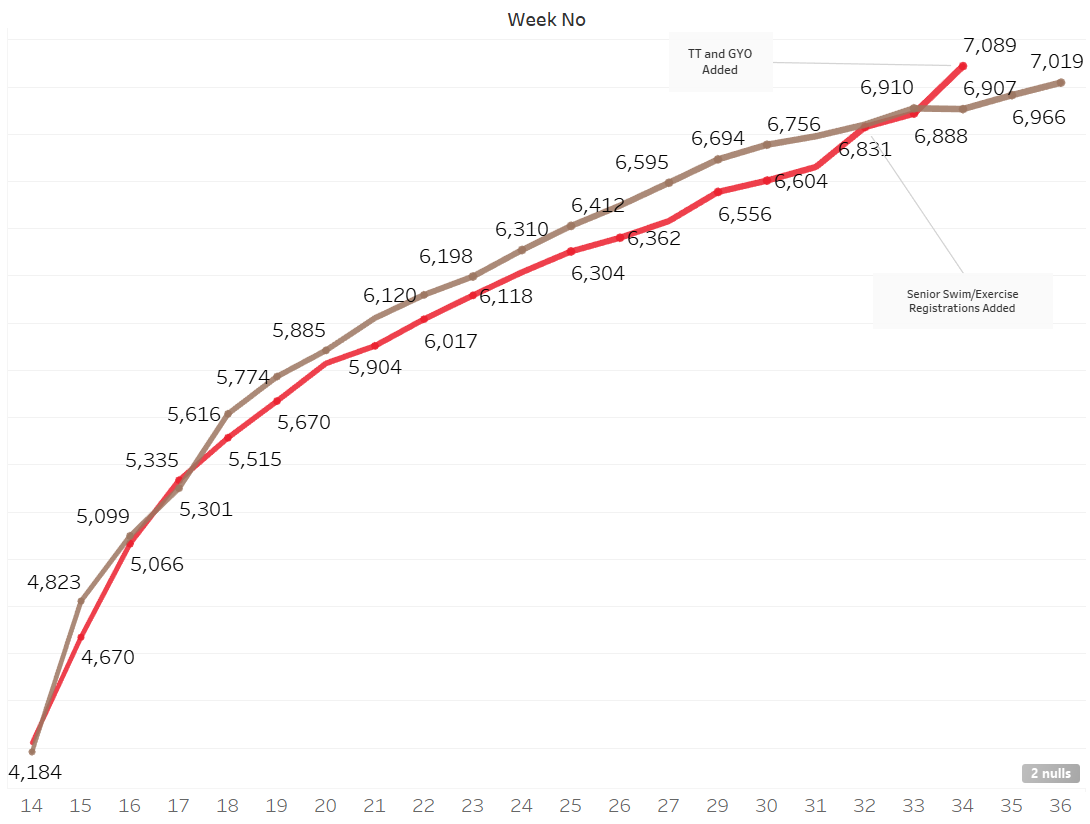
Winter to Fall persistence continues to see gains week after week as well with higher numbers of students who should be returning to continue their education doing so. Overall UG rates are the highest since this data has been captured starting in 2017 currently at 88.3% of UG students returning. The previous high water mark was in 2020 (87.9%) but those rates didn't hold as students learned about the changes Covid would force on their learning experience and in their lives at home. For reference, an increase in this persistence rate from 86.5% (last year) to this year's 88.3% yields a net of +79 students; a seemingly small +1.8% point increase can have a big impact on the overall counts. Persistence gains were also seen last year between Fall 2022 to Winter 2023 so this gives me optimism that, at 10th day, we'll see an increase in our overall 1st to 3rd retention rate as well as in other key points in time (5th semester, etc.).
A closer look at Fall 2023:
Undergraduate headcount compared to this week last fall:
• New Freshmen: +9.2% (+131, n=1,556)
• New Transfer: +13.1% (+48, n=414)
• Undergrad Readmits: -8.8% (-9, n=93)
• Postbaccalaureate: +17.5% (+10, n=67)
• Postbaccalaureate Reentry: -50.0% (-2, n=2)
• Undergrad Nondegree: +27.6% (+21, n=97)
• Continuing Undergrad: -1.6% (-69, n=4,297)
• Undergraduate - Total: +2.0% (+129, n=6,526)
Graduate headcount:
• New Graduate: +23.1% (+31, n=165)
• Readmitted Grad: +15.4% (+2, n=15)
• Continuing Grad: +5.5% (+20, n=383)
• Graduate - Total: +10.4% (+53, n=563)
Overall headcount:
• Overall - Total Headcount: +2.6% (+182, n=7,089)
Student Credit Hours:
• Overall Student Credit Hours: +2.1% (+1,925, n=92,233)
Full-time Equivalent Students (FTE):
For FTE calcs, UG credit hours divide by 15 and graduate credit hours divided by 12
• Undergraduate FTE: +1.8% (+102.2, n=5,911.4)
• Graduate FTE: +12.4% (+32.7, n=296.9)
• Overall FTE: +2.2% (+134.9, n=6,208.2)
Comparative Enrollment & Cr Hrs by Student Category - Fall 2023
Jason Nicholas
Assistant Provost and Director for Institutional Effectiveness
Northern Michigan University
1401 Presque Isle Ave
Marquette, MI 49855-5301
906-227-2379
nmu.edu/ie
IE Weekly Report - 8.11.23
IE Weekly Report - 8.11.23
*Note, figures displayed below include Global Campus counts unless otherwise noted.
Good afternoon,
Jason is out of the office today so I’m posting the weekly report in his absence. All major categories remained nearly unchanged compared to last week. See below for the individual segments as well as links to the spreadsheets.
A closer look at Fall 2023:
Undergraduate headcount compared to this week last fall:
|
• New Freshmen: +8.3% (+119, n=1,547) |
|
• New Transfer: -15.3% (-54, n=300) |
|
• Undergrad Readmits: -15.7% (-16, n=86) |
|
• Postbaccalaureate: -3.4% (-2, n=57) |
|
• Postbaccalaureate Reentry: -50.0% (-2, n=2) |
|
• Undergrad Nondegree: +28.6% (+20, n=90) |
|
• Continuing Undergrad: -1.9% (-84, n=4,301) |
|
• Undergraduate - Total: -0.3% (-19, n=6,383) |
Graduate headcount:
|
• New Graduate: -9.0% (-12, n=121) |
|
• Readmitted Grad: -7.1% (-1, n=13) |
|
• Continuing Grad: +2.8% (+10, n=371) |
|
• Graduate - Total: -0.6% (-3, n=505) |
Overall headcount:
• Overall - Total Headcount: -0.3% (-22, n=6,888)
Student Credit Hours:
• Overall Student Credit Hours: +0.6% (+539, n=90,578)
Full-time Equivalent Students (FTE):
For FTE calcs, UG credit hours divide by 15 and graduate credit hours divided by 12
|
• Undergraduate FTE: +0.4% (+22.7, n=5,815.7) |
|
|
• Graduate FTE: +6.3% (+16.5, n=278.5) |
|
|
• Overall FTE: +0.6% (+39.2, n=6,094.2) |
|
Comparative Enrollment & Cr Hrs by Student Category - Fall 2023
Comparative Enrollment & Cr Hrs by Student Category - Summer 2023
Thank you,
Katie Schoonveld
Director of Institutional Reporting
Northern Michigan University
1401 Presque Isle Ave
Marquette, MI 49855-5301
906-227-2675
nmu.edu/ie
IE Weekly Report - 8.4.23
IE Weekly Report - 8.4.23
*Note, figures displayed below include Global Campus counts unless otherwise noted.
Good afternoon,
Jason is out of the office today so I’m posting the weekly report in his absence. UG New First-time Freshmen continue to show positive indicators and are at +8.2% (+116, n=1,539). Continuing Undergrad is currently at -1.9% (-83, n=4,300) and Continuing Grad is at +7.0% (+24, n=366). Both categories saw a noticeable increase compared to last week although these changes appear to be non-degree increases for registrations from the community. The overall SCH counts are pretty close to the same as last week at +0.2% (+206, n=89,637.5). These changes have us Overall at -0.1% (-10, N=6,831) compared to this time last fall.
A closer look at Fall 2023:
Undergraduate headcount compared to this week last fall:
|
• New Freshmen: +8.2% (+116, n=1,539) |
|
• New Transfer: -16.2% (-55, n=284) |
|
• Undergrad Readmits: -17.9% (-17, n=78) |
|
• Postbaccalaureate: -5.5% (-3, n=52) |
|
• Postbaccalaureate Reentry: -50.0% (-2, n=2) |
|
• Undergrad Nondegree: +39.7% (+25, n=88) |
|
• Continuing Undergrad: -1.9% (-83, n=4,300) |
|
• Undergraduate - Total: -0.3% (-19, n=6,343) |
Graduate headcount:
|
• New Graduate: -8.1% (-10, n=113) |
|
• Readmitted Grad: -35.7% (-5, n=9) |
|
• Continuing Grad: +7.0% (+24, n=366) |
|
• Graduate - Total: +1.9% (+9, n=488) |
Overall headcount:
• Overall - Total Headcount: -0.1% (-10, n=6,831)
Student Credit Hours:
• Overall Student Credit Hours: +0.2% (+206, n=89,637.5)
Full-time Equivalent Students (FTE):
For FTE calcs, UG credit hours divide by 15 and graduate credit hours divided by 12
|
• Undergraduate FTE: 0.0% (+1.1, n=5,759.9) |
|
• Graduate FTE: +6.2% (+15.8, n=269.9) |
|
• Overall FTE: +0.3% (+16.9, n=6,029.8) |
Comparative Enrollment & Cr Hrs by Student Category - Fall 2023
Comparative Enrollment & Cr Hrs by Student Category - Summer 2023
Thank you,
Katie Schoonveld
Director of Institutional Reporting
Northern Michigan University
1401 Presque Isle Ave
Marquette, MI 49855-5301
906-227-2675
nmu.edu/ie
IE Weekly Report - 7.28.23
IE Weekly Report - 7.28.23
*Note, figures displayed below include Global Campus counts unless otherwise noted.
Good afternoon,
UG New First-time Freshmen bumped up a bit over last week moving from +7.1% to +8.4%; a 1.3 pt. increase. Nearly all other major categories remained nearly unchanged compared to last week. See below for the individual segments as well as links to the spreadsheets.
A closer look at Fall 2023:
Undergraduate headcount compared to this week last fall:
| • New Freshmen: +8.4% (+119, n=1,528) |
| • New Transfer: -17.0% (-55, n=268) |
| • Undergrad Readmits: -17.6% (-16, n=75) |
| • Postbaccalaureate: -2.0% (-1, n=50) |
| • Postbaccalaureate Reentry: -50.0% (-2, n=2) |
| • Undergrad Nondegree: +42.6% (+26, n=87) |
| • Continuing Undergrad: -4.5% (-198, n=4187) |
| • Undergraduate - Total: -2.0% (-127, n=6,197) |
Graduate headcount:
| • New Graduate: -5.9% (-7, n=112) |
| • Readmitted Grad: -38.5% (-5, n=8) |
| • Continuing Grad: +2.7% (+9, n=345) |
| • Graduate - Total: -0.6% (-3, n=465) |
Overall headcount:
| • Overall - Total Headcount: -1.9% (-130, n=6,662) |
Student Credit Hours:
| • Overall Student Credit Hours: 0.0% (-26.5, n=88,574.5) |
Full-time Equivalent Students (FTE):
For FTE calcs, UG credit hours divide by 15 and graduate credit hours divided by 12
| • Undergraduate FTE: -0.3% (-14.4, n=5,693.4) |
| • Graduate FTE: +6.4% (15.8, n=264.5) |
| • Overall FTE: 0.0% (+1.4, n=5,957.9) |
Comparative Enrollment & Cr Hrs by Student Category - Fall 2023
Comparative Enrollment & Cr Hrs by Student Category - Summer 2023
Thank you,
Jason Nicholas
Assistant Provost and Director for Institutional Effectiveness
Northern Michigan University
1401 Presque Isle Ave
Marquette, MI 49855-5301
906-227-2379
nmu.edu/ie
IE Weekly Report - 7.21.23
IE Weekly Report - 7.21.23
*Note, figures displayed below include Global Campus counts unless otherwise noted.
Good afternoon,
This week we are checking in to see how close we are to our final counts. Below is a table I've shared earlier in week 25 but with updated counts for week 30.
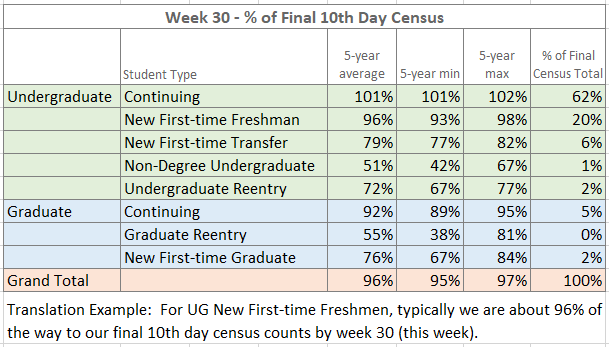
As you can see, we are pretty close to the final counts that we'll be showing at 10th-day. If we estimate in that final 4% in additional students, that'll put our overall headcount somewhere around 6,880 which would be an overall decline of -2.0% compared to 10th day last year (N=6,970). Now, there's still time for wildcards like grant programs that lead to enrollment, non-degree counts from k12 partners in dual and middle college, and make-up orientation. We'll have to wait and see. For now, UG New First-time Freshmen continue to show positive indicators and are +7.6% (+100, n=1,502) with UG New Transfers (-16.0%, -49, n=258) and UG Continuing (-4.5%, -197, n=4,189) showing declines.
Winter to Fall persistence for students with unfinished business continues to show strong signs as well with +2.0% more students anticipated to return this fall compared to last cycle. This equates to an additional +80 UG students. Reminder, these numbers include all undergraduate degree-seeking programs.
A closer look at Fall 2023:
Undergraduate headcount compared to this week last fall:
| • New Freshmen: +7.1% (+100, n=1502) |
| • New Transfer: -16.0% (-49, n=258) |
| • Undergrad Readmits: -21.6% (-19, n=69) |
| • Postbaccalaureate: -2.0% (-1, n=49) |
| • Postbaccalaureate Reentry: -50.0% (-2, n=2) |
| • Undergrad Nondegree: +43.1% (+25, n=83) |
| • Continuing Undergrad: -4.5% (-197, n=4189) |
| • Undergraduate - Total: -2.3% (-142, n=6153) |
Graduate headcount:
| • New Graduate: -9.6% (-11, n=104) |
| • Readmitted Grad: -27.3% (-3, n=8) |
| • Continuing Grad: +1.2% (+4, n=339) |
| • Graduate - Total: -2.2% (-10, n=451) |
Overall headcount:
| • Overall - Total Headcount: -2.2% (-152, n=6604) |
Student Credit Hours:
| • Overall Student Credit Hours: -0.3% (-291, n=87798) |
Full-time Equivalent Students (FTE):
For FTE calcs, UG credit hours divide by 15 and graduate credit hours divided by 12
| • Undergraduate FTE: -0.5% (-27.5, n=5647.1) |
| • Graduate FTE: +4.1% (+10.1, n=257.6) |
| • Overall FTE: -0.3% (-17.4, n=5904.7) |
Comparative Enrollment & Cr Hrs by Student Category - Fall 2023
Comparative Enrollment & Cr Hrs by Student Category - Summer 2023
Thank you,
Jason Nicholas
Assistant Provost and Director for Institutional Effectiveness
Northern Michigan University
1401 Presque Isle Ave
Marquette, MI 49855-5301
906-227-2379
nmu.edu/ie
IE Weekly Report - 7.14.23
IE Weekly Report - 7.14.23
*Note, figures displayed below include Global Campus counts unless otherwise noted.
Good afternoon,
Jason is out of the office today so I’m posting the weekly report in his absence. UG New First-time Freshmen are currently at +8.4% (+116, n=1,503). Slight improvements in UG Continuing at -4.9% (-217, n=4,187). These changes have us Overall at -2.1% (-138, N=6,556) compared to this time last fall.
A closer look at Fall 2023:
Undergraduate headcount compared to this week last fall:
|
• New Freshmen: +8.4% (+116, n=1,503) |
|
• New Transfer: -13.8% (-38, n=238) |
|
• Undergrad Readmits: -26.3% (-21, n=59) |
|
• Postbaccalaureate: +13.6% (+6, n=50) |
|
• Postbaccalaureate Reentry: -50.0% (-1, n=1) |
|
• Undergrad Nondegree: +20.7% (+12, n=70) |
|
• Continuing Undergrad: -4.9% (-217, n=4,187) |
|
• Undergraduate - Total: -2.3% (-143, n=6,108) |
Graduate headcount:
|
• New Graduate: -8.9% (-10, n=102) |
|
• Readmitted Grad: +14.3% (+1, n=8) |
|
• Continuing Grad: +4.3% (+14, n=338) |
|
• Graduate - Total: +1.1% (+5, n=448) |
Overall headcount:
• Overall - Total Headcount: -2.1% (-138, n=6,556)
Student Credit Hours:
• Overall Student Credit Hours: -0.2% (-212.5, n=87,161)
Full-time Equivalent Students (FTE):
For FTE calcs, UG credit hours divide by 15 and graduate credit hours divided by 12
|
• Undergraduate FTE: -0.4% (-24.5, n=5,606.9) |
|
|
• Graduate FTE: +5.3% (+12.9, n=254.8) |
|
|
• Overall FTE: -0.2% (-11.6, n=5,861.7) |
|
Comparative Enrollment & Cr Hrs by Student Category - Fall 2023
Comparative Enrollment & Cr Hrs by Student Category - Summer 2023
Thank you,
Katie Schoonveld
Director of Institutional Reporting
Northern Michigan University
1401 Presque Isle Ave
Marquette, MI 49855-5301
906-227-2675
nmu.edu/ie
IE Weekly Report - 7.7.23
IE Weekly Report - 7.7.23
*Note, figures displayed below include Global Campus counts unless otherwise noted.
Good afternoon,
Jason is out of the office today so I’m posting the weekly report in his absence. UG New First-time Freshmen are currently at +9.4% (+127, n=1,484). Last week we were up +7.5% compared to 2022, so this is a noticeable increase. Slight improvements in UG Continuing at -5.0% (-221, n=4,179). These changes have us Overall at -2.1% (-136, N=6,483) compared to this time last fall.
A closer look at Fall 2023:
Undergraduate headcount compared to this week last fall:
|
• New Freshmen: +9.4% (+127, n=1,484) |
|
• New Transfer: -14.3% (-36, n=216) |
|
• Undergrad Readmits: -31.6% (-25, n=54) |
|
• Postbaccalaureate: +11.6% (+5, n=48) |
|
• Postbaccalaureate Reentry: -50.0% (-1, n=1) |
|
• Undergrad Nondegree: +7.4% (+4, n=58) |
|
• Continuing Undergrad: -5.0% (-221, n=4,179) |
|
• Undergraduate - Total: -2.4% (-147, n=6,040) |
Graduate headcount:
|
• New Graduate: -9.1% (-10, n=100) |
|
• Readmitted Grad: +33.3% (+2, n=8) |
|
• Continuing Grad: +6.0% (+19, n=335) |
|
• Graduate - Total: +2.5% (+11, n=443) |
Overall headcount:
• Overall - Total Headcount: -2.1% (-136, n=6,483)
Student Credit Hours:
• Overall Student Credit Hours: -0.1% (-110.5, n=86,185)
Full-time Equivalent Students (FTE):
For FTE calcs, UG credit hours divide by 15 and graduate credit hours divided by 12
|
• Undergraduate FTE: -0.4% (-20.7, n=5,543.4) |
|
|
• Graduate FTE: +7.1% (+16.7, n=252.9) |
|
|
• Overall FTE: -0.1% (-4.0, n=5,796.2) |
|
Comparative Enrollment & Cr Hrs by Student Category - Fall 2023
Comparative Enrollment & Cr Hrs by Student Category - Summer 2023
Thank you,
Katie Schoonveld
Director of Institutional Reporting
Northern Michigan University
1401 Presque Isle Ave
Marquette, MI 49855-5301
906-227-2675
nmu.edu/ie
IE Weekly Report - 6.30.23
IE Weekly Report - 6.30.23
*Note, figures displayed below include Global Campus counts unless otherwise noted.
Happy Friday! I hope everyone enjoys a nice break and extended holiday weekend.
Just a quick update this week as we are in the middle of the slow march towards the Fall semester. The overall headcount numbers dipped slightly compared to last week today. Many things can influence these shifts; something as simple as a key person being on vacation can alter the way these counts roll in so we won't worry too much about this dip, but we will use it as a reason to keep a close eye on things as we always do. For now, we are currently -2.5% overall compared to this time last year (-162, N=6,433). UG New Freshmen are at +7.5% (+102, n=1,465) and UG Continuing is at -5.1% (-175, n=5,996). New Graduate are at -2 (-2.0%, n=100) and Continuing Grad are at +13 (+4.1, n=437). Student credit hours continue to exceed headcounts and are currently at -0.7% (-562, N=85,185).
Undergraduate winter-to-fall persistence continues to run positive up +1.4% over last year with 88.0% of students who completed Winter 2023, and who have unfinished business and did not graduate or stop-out, registered for this coming Fall 2023.
A closer look at Fall 2023:
Undergraduate headcount compared to this week last fall:
| • New Freshmen: +7.5% (+102, n=1,465) |
| • New Transfer: -14.9% (-36, n=206) |
| • Undergrad Readmits: -29.3% (-22, n=53) |
| • Postbaccalaureate: +7.3% (+3, n=44) |
| • Postbaccalaureate Reentry: -50.0% (-1, n=1) |
| • Undergrad Nondegree: +7.4% (+4, n=58) |
| • Continuing Undergrad: -5.1% (-225, n=4,169) |
| • Undergraduate - Total: -2.8% (-175, n=5,996) |
Graduate headcount:
| • New Graduate: -2.0% (-2, n=100) |
| • Readmitted Grad: +33.3% (+2, n=8) |
| • Continuing Grad: +4.1% (+13, n=329) |
| • Graduate - Total: +3.1% (+13, n=437) |
Overall headcount:
| • Overall - Total Headcount: -2.5% (-162, n=6,433) |
Student Credit Hours:
| • Overall Student Credit Hours: -0.7% (-562, n=85,185) |
Full-time Equivalent Students (FTE):
For FTE calcs, UG credit hours divide by 15 and graduate credit hours divided by 12
| • Undergraduate FTE: -0.9% (-51.9, n=5,479.2) |
| • Graduate FTE: +7.8% (+18.0, n=249.7) |
| • Overall FTE: -0.6% (-33.9, n=5,728.9) |
Comparative Enrollment & Cr Hrs by Student Category - Fall 2023
Comparative Enrollment & Cr Hrs by Student Category - Summer 2023
Thank you,
Jason Nicholas
Assistant Provost and Director for Institutional Effectiveness
Northern Michigan University
1401 Presque Isle Ave
Marquette, MI 49855-5301
906-227-2379
nmu.edu/ie
IE Weekly Report - 6.23.23
IE Weekly Report - 6.23.23
*Note, figures displayed below include Global Campus counts unless otherwise noted.
Good afternoon,
Jason is out of the office today so I’m posting the weekly report in his absence. This week's reporting, counts are very similar to last week with UG New First-time Freshmen at (+7.0%, +93, n=1,424) and slight improvements in UG Continuing (-5.1%, -223, n=4,160). These changes have us Overall at -2.1% (-136, N=6,362) compared to this time last fall.
A closer look at Fall 2023:
Undergraduate headcount compared to this week last fall:
|
• New Freshmen: +7.0% (+93, n=1,424) |
|
• New Transfer: -13.2% (-30, n=197) |
|
• Undergrad Readmits: -30.6% (-22, n=50) |
|
• Postbaccalaureate: 0.0% (0, n=42) |
|
• Postbaccalaureate Reentry: -50.0% (-1, n=1) |
|
• Undergrad Nondegree: +147.8% (+34, n=57) |
|
• Continuing Undergrad: -5.1% (-223, n=4,160) |
|
• Undergraduate - Total: -2.5% (-149, n=5,931) |
Graduate headcount:
|
• New Graduate: -2.0% (-2, n=99) |
|
• Readmitted Grad: +40.0% (+2, n=7) |
|
• Continuing Grad: +4.2% (+13, n=325) |
|
• Graduate - Total: +3.1% (+13, n=431) |
Overall headcount:
• Overall - Total Headcount: -2.1% (-136, n=6,362)
Student Credit Hours:
• Overall Student Credit Hours: -0.9% (-779, n=83,355)
Full-time Equivalent Students (FTE):
For FTE calcs, UG credit hours divide by 15 and graduate credit hours divided by 12
|
• Undergraduate FTE: -1.2% (-67.4, n=5,359.5) |
|
|
• Graduate FTE: +8.5% (+19.3, n=246.9) |
|
|
• Overall FTE: -0.9% (-48.1, n=5,606.4) |
|
Comparative Enrollment & Cr Hrs by Student Category - Fall 2023
Comparative Enrollment & Cr Hrs by Student Category - Summer 2023
Thank you,
Katie Schoonveld
Director of Institutional Reporting
Northern Michigan University
1401 Presque Isle Ave
Marquette, MI 49855-5301
906-227-2675
nmu.edu/ie
IE Weekly Report - 6.16.23
IE Weekly Report - 6.16.23
*Note, figures displayed below include Global Campus counts unless otherwise noted.
Good morning,
Typically around this time of the cycle, I like to give us a sense of where we are in the accumulation towards our final counts. In other words, by week 25 (this week) what percent of our final counts are we at? Below is a table that shows you the 5 year averages by segment but also includes the min/max for the last 5 years as well as each segment's percent of the overall total population. This table represents the steady march towards our final census counts and is used in my modeling as I provide my best estimate of what fall enrollment will look like.
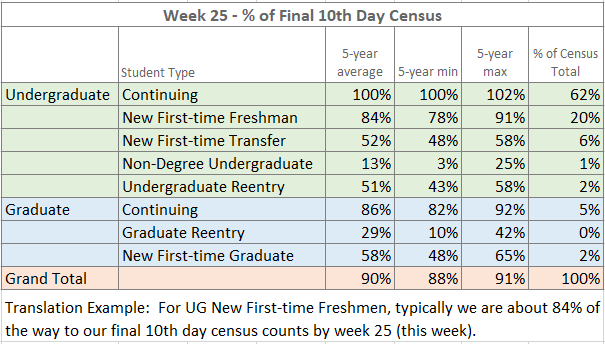
As you can see, usually by this point, we have 100% of our final UG Continuing counts and, in some years, we are over our final counts and summer re-enrollment melt will bring that count down a bit before census. If this holds true, we can expect to see smaller final counts in UG Continuing to hold steady with the trends we've been seeing for the last few weeks. Again, this is mostly due to the large graduating classes over the last 2 years and the classes behind them being smaller. This is not a function of students not returning at higher rates. Our re-enrollment persistence rate continues to trend ahead of the last few years indicating that students with unfinished business are re-enrolling at higher rates than in the recent past.
For UG New First-time Freshmen, the story is a little bit different because we've made changes to the enrollment process over the last few years. You can see in the table, typically we are at about 84% of our final census counts by now. However, that average is a little off, and in the last 2 years, we've been more like 91% of the way to our final counts where prior to block scheduling changes, we'd have been at about 80%. I correct for this in my model and use only the last two years.
Based on where we are in the cycle and the data I'm seeing now, I'm expecting us to be somewhere in the +6% to +8% for New First-time Freshmen, down about -5.5% for UG Continuing and Overall UG and Grad combined down between -2.0% to -2.5%. Still a ways to go, but this gives us a sense of where things may be in the fall. Interestingly, student credit hours continue to run about a point stronger than overall headcount (N=82,064.5, -454, -0.6%).
A closer look at Fall 2023:
Undergraduate headcount compared to this week last fall:
| • New Freshmen: +8.7% (+113, n=1,412) |
| • New Transfer: -8.0% (-16, n=185) |
| • Undergrad Readmits: -33.8% (-24, n=47) |
| • Postbaccalaureate: +2.4% (+1, n=42) |
| • Postbaccalaureate Reentry: -50.0% (-1, n=1) |
| • Undergrad Nondegree: +145.5% (+32, n=54) |
| • Continuing Undergrad: -5.2% (-227, n=4,139) |
| • Undergraduate - Total: -2.0% (-122, n=5,880) |
Graduate headcount:
| • New Graduate: -1.0% (-1, n=99) |
| • Readmitted Grad: +40.0% (+2, n=7) |
| • Continuing Grad: +4.3% (+13, n=318) |
| • Graduate - Total: +3.4% (+14, n=424) |
Overall headcount:
| • Overall - Total Headcount: -1.7% (-108, n=6,304) |
Student Credit Hours:
| • Overall Student Credit Hours: -0.6% (-454, n=82,064.5) |
Full-time Equivalent Students (FTE):
For FTE calcs, UG credit hours divide by 15 and graduate credit hours divided by 12
| • Undergraduate FTE: -0.9% (-46.1, n=5,275.3) |
| • Graduate FTE: +8.8% (+19.8, n=244.5) |
| • Overall FTE: -0.5% (-26.3, n=5,519.9) |
Comparative Enrollment & Cr Hrs by Student Category - Fall 2023
Comparative Enrollment & Cr Hrs by Student Category - Summer 2023
Thank you,
Jason Nicholas
Assistant Provost and Director for Institutional Effectiveness
Northern Michigan University
1401 Presque Isle Ave
Marquette, MI 49855-5301
906-227-2379
nmu.edu/ie
IE Weekly Report - 6.9.23
IE Weekly Report - 6.9.23
*Note, figures displayed below include Global Campus counts unless otherwise noted.
Good morning,
Jason is out on annual leave today so today's report is provided by Katie Schoonveld.
This week's reporting, counts are very similar to last week with small gains in UG New First-time Freshmen (+11.3%, +139, n=1,366) and slight improvements in UG Continuing (-5.4%, -234, n=4,128). These changes have us Overall at -1.5% (-94, N=6,216) compared to this time last fall.
A closer look at Fall 2023:
Undergraduate headcount compared to this week last fall:
- New Freshmen: +11.3% (+139,n=1,366)
- New Transfer: -13.6% (-26,n=165)
- Undergrad Readmits: -34.8% (-24, n=45)
- Postbaccalaureate: 0.0% (0,n=41)
- Postbaccalaureate Reentry: -50.0% (-1,n=1)
- Undergrad Nondegree: +140.9% (+31, n=53)
- Continuing Undergrad: -5.4% (-234, n=4,128)
- Undergraduate - Total: -1.9% (-115, n=5,799)
Graduate headcount:
- New Graduate: 0.0% (0,n=95)
- Readmitted Grad: +40.0% (+2,n=7)
- Continuing Grad: +6.4% (+19,n=315)
- Graduate - Total: +5.3% (+21,n=417)
Overall headcount:
• Overall - Total Headcount: -1.5% (-94, n=6,216)
Student Credit Hours:
• Overall Student Credit Hours: -0.7% (-573, n=80,100.5)
Full-time Equivalent Students (FTE):
For FTE calcs, UG credit hours divide by 15 and graduate credit hours divided by 12
- Undergraduate FTE: -1.1% (-58.7, n=5,146.4)
- Graduate FTE: +11.9% (+25.7, n=242.0)
- Overall FTE: -0.6% (-33.1, n=5,388.4)
Comparative Enrollment & Cr Hrs by Student Category - Fall 2023
Comparative Enrollment & Cr Hrs by Student Category - Summer 2023
Thank you,
Katie Schoonveld
Director of Institutional Reporting
Northern Michigan University
1401 Presque Isle Ave
Marquette, MI 49855-5301
906-227-2675
nmu.edu/ie
IE Report - 10th Day Summer 2023
IE Report - 10th Day Summer 2023
Good afternoon,
Below is a brief update on our Summer 2023 10th day enrollment. I've included two reports with this email.
- Comparative report showing Headcount, SCH and FTE by Student Type
- Academic Department report showing Headcount and SCH by Undergraduate and Graduate Level
A closer look at Summer 2023:
Headcounts compared to this last summer:
- Overall – Total Headcount: +2.9% (+50,n=1,758)
- Undergraduate – Total: +2.3%(+32, n=1,411)
- Graduate – Total: +5.5% (+18, n=347)
- Global Campus: +13.0% (+45, n=391)
Student Credit Hours:
- Overall – Student Credit Hours: +4.3% (+438, n=10,507)
- Undergraduate SCH– Total: +3.8% (+326, n=8,977)
- Graduate SCH – Total: +7.9% (+112, n=1,530)
- Global Campus SCH: +16.7% (+334, n=2,332)
Full-time Equivalent Students (FTE):
For FTE calcs, UG credit hours divide by 15 and graduate credit hours divided by 12
Overall – FTE: +4.5% (+31, n=726.0)
- Undergraduate FTE– Total: +3.8% (+22, n=598.5)
- Graduate FTE – Total: +7.9% (+9, n=127.5)
- Global Campus FTE: +16.3% (+24, n=173.3)
Let me know if you have any questions or if there are other reports you’re interested in having at this time.
Comparative Headcount SCH and FTE by Student Type Summer 2023
Academic Department HD and SCH UG and GR Multi-year History - SU 19-23
Thank you,
|
|
Katie Schoonveld 410C Cohodas Hall | 1401 Presque Isle Ave, Marquette, MI 49855 |

IE Weekly Report - 6.2.23
IE Weekly Report - 6.2.23
*Note, figures displayed below include Global Campus counts unless otherwise noted.
Good afternoon,
A friendly reminder that starting next week, we will centralize our enrollment cycle reporting through one website called NMU Weekly Enrollment Reporting. All information will be behind an NMU login so you'll need to sign in to gain access. As we make this shift, if you have feedback on how we can improve this process, please let me know.
Just a brief update today as we are in between the end of the Winter semester and the beginning of orientation, which is typically a period where the numbers are fairly stable.
As for this week's reporting, counts are very similar to last week with small gains in UG New First-time Freshmen (+12.5%, +148, n=1,331) and slight improvements in UG Continuing (-5.2%, -228, n=4,116). These changes have us Overall at -1.3% (-80, N=6,118) compared to this time last fall.
A closer look at Fall 2023:
Undergraduate headcount compared to this week last fall:
• New Freshmen: +12.5% (+148, n=1,331)
• New Transfer: -13.5% (-21, n=134)
• Undergrad Readmits: -28.8% (-17, n=42)
• Postbaccalaureate: 0.0% (0, n=40)
• Postbaccalaureate Reentry: -50.0% (-1, n=1)
• Undergrad Nondegree: +100.0% (+22, n=44)
• Continuing Undergrad: -5.2% (-228, n=4116)
• Undergraduate - Total: -1.7% (-97, n=5,708)
Graduate headcount:
• New Graduate: -4.3% (-4, n=89)
• Readmitted Grad: +40.0% (+2, n=7)
• Continuing Grad: +6.4% (+19, n=314)
• Graduate - Total: +4.3% (+17, n=410)
Overall headcount:
• Overall - Total Headcount: -1.3% (-80, n=6,118)
Student Credit Hours:
• Overall Student Credit Hours: -0.7% (-527.5, n=78,223.5)
Full-time Equivalent Students (FTE):
For FTE calcs, UG credit hours divide by 15 and graduate credit hours divided by 12
• Undergraduate FTE: -1.0% (-51.4, n=5,026.7)
• Graduate FTE: +9.4% (+20.3, n=235.3)
• Overall FTE: -0.6% (-31.1, n=5,262.0)
See this link for detailed Excel versions of reports.
Thank you,
Jason Nicholas
Assistant Provost and Director for Institutional Effectiveness
Northern Michigan University
1401 Presque Isle Ave
Marquette, MI 49855-5301
906-227-2379
nmu.edu/ie
IE Weekly Report - 5.26.23
IE Weekly Report - 5.26.23
*Note, figures displayed below include Global Campus counts unless otherwise noted.
Happy Memorial Day Weekend to All,
For a few years now, we've been working on improving the weekly enrollment reporting with the focus mostly on improving the way we analyze and tell the story of our enrollment cycles. In the spirit of continual improvement, we want to shift gears a little bit and focus on communications systems. We've recognized that there is a need to better organize the different enrollment reporting channels into one central location with the ability to archive past reports. Moving forward, Admissions, Graduate Education, Global Campus, and Institutional Effectiveness will centralize our enrollment cycle reporting through one website called NMU Weekly Enrollment Reporting. All information will be behind an NMU login so you'll need to sign in to gain access.
For this week and next week, we'll continue to send our emails as we always have. Starting the week of June 5th, we will begin posting enrollment updates exclusively through the website with only a simple email being sent out on Fridays to remind you to check the website for this week's reports. As we make this shift, if you have feedback on how we can improve this process, please let me know.
As for this week's reporting, counts are very similar to last week with small gains in UG New First-time Freshmen (+12.7%, +146, n=1,295) but slight declines in UG Continuing (-5.5%, -237, n=4,096). These changes have us Overall at -1.7% (-103, N=6,017) compared to this time last fall.
Overall headcount, weeks 14-36, currently red line week 22
The summer semester has also started, and once the summer census snap is taken, we'll provide some breakdown of counts and comparisons. For now, the preliminary counts are included in the hyperlinked reports below.
A closer look at Fall 2023:
Undergraduate headcount compared to this week last fall:
• New Freshmen: +12.7% (+146, n=1,295)
• New Transfer: -5.3% (-7, n=124)
• Undergrad Readmits: -31.6% (-18, n=39)
• Postbaccalaureate: 0.0% (0, n=39)
• Postbaccalaureate Reentry: -50.0% (-1, n=1)
• Undergrad Nondegree: -4.8% (-1, n=20)
• Continuing Undergrad: -5.5% (-237, n=4,096)
• Undergraduate - Total: -2.1% (-118, n=5,614)
Graduate headcount:
• New Graduate: -5.4% (-5, n=87)
• Readmitted Grad: +75.0% (+3, n=7)
• Continuing Grad: +5.8% (+17, n=309)
• Graduate - Total: +3.9% (+15, n=403)
Overall headcount:
• Overall - Total Headcount: -1.7% (-103, n=6,017)
Student Credit Hours:
• Overall Student Credit Hours: -0.9% (-683, n=76,825)
Full-time Equivalent Students (FTE):
For FTE calcs, UG credit hours divide by 15 and graduate credit hours divided by 12
• Undergraduate FTE: -1.2% (-61.6, n=4,936.9)
• Graduate FTE: +9.5% (+20.1, n=231.0)
• Overall FTE: -0.8% (-41.5, n=5,167.9)
See this link for detailed Excel versions of reports.
Thank you,
Jason Nicholas
Assistant Provost and Director for Institutional Effectiveness
Northern Michigan University
1401 Presque Isle Ave
Marquette, MI 49855-5301
906-227-2379
nmu.edu/ie
IE Weekly Report - 5.19.23
IE Weekly Report - 5.19.23
*Note, figures displayed below include Global Campus counts unless otherwise noted.
Good afternoon,
We are seeing a little bit of a step back again in the numbers. Overall Headcount is at -2.0% (N=5,904, -118). Last week we were at -0.9%. Student credit hours are a little better at -0.7% behind last year so I'm not overly concerned at this point. Other leading indicators like admits, orientation and housing registrations, and New First-time Freshmen (+10.0%, n=1,233, +112) are still holding strong. As mentioned last week, I anticipate we'll have had a larger graduating class than last year so that is my leading guess when it comes to what is driving the decline in overall counts.
Winter-to-Fall persistence numbers are also holding strong. Across all UG degree types, 86.8% of students who should be returning to continue their education have registered. This is +1.9 pts. over last year. That nearly 2% increase equates to about +85 more students than if we had last year's rate of 84.9% of students re-enrolling. With strong persistence and new freshmen numbers, things are sitting pretty solid for now.
Overall headcount, weeks 14-36, currently red line week 21
Summer preliminary counts are also in and we are +0.7% for overall headcount (N=1,745, +12) with student credit hours up +3.8% (N=10,647, +386) compared to last summer. See the attached report for details.
A closer look at Fall 2023:
Undergraduate headcount compared to this week last fall:
• New Freshmen: +10.0% (+112, n=1,233)
• New Transfer: -4.3% (-5, n=110)
• Undergrad Readmits: -33.3% (-18, n=36)
• Postbaccalaureate: -2.6% (-1, n=38)
• Postbaccalaureate Reentry: 0.0% (0, n=1)
• Undergrad Nondegree: +12.5% (+2, n=18)
• Continuing Undergrad: -5.0% (-213, n=4,080)
• Undergraduate - Total: -2.2% (-123, n=5,516)
Graduate headcount:
• New Graduate: -13.5% (-12, n=77)
• Readmitted Grad: +50.0% (+2, n=6)
• Continuing Grad: +5.2% (+15, n=305)
• Graduate - Total: +1.3% (+5, n=388)
Overall headcount:
• Overall - Total Headcount: -2.0% (-118, n=5,904)
Student Credit Hours:
• Overall Student Credit Hours: -0.7% (-527.5, n=75,481.5)
Full-time Equivalent Students (FTE):
For FTE calcs, UG credit hours divide by 15 and graduate credit hours divided by 12
• Undergraduate FTE: -0.9% (-44.3, n=4,857.3)
• Graduate FTE: 5.5% (+11.4, n=+218.5)
• Overall FTE: -0.6% (-32.9, n=5,075.8)
See this link for detailed Excel versions of reports.
Thank you,
Jason Nicholas
Assistant Provost and Director for Institutional Effectiveness
Northern Michigan University
1401 Presque Isle Ave
Marquette, MI 49855-5301
906-227-2379
nmu.edu/ie
IE Weekly Report - 5.12.23
IE Weekly Report - 5.12.23
*Note, figures displayed below include Global Campus counts unless otherwise noted.
Happy Friday all!
Note that the summer enrollment report is also now attached below.
We are a few weeks out before the first orientation sessions around week 23 and typically this is where we start to see some of that early cycle instability calm down. As you can see below highlighted in the red box, there is a steady march toward orientation where we can expect to add a couple of hundred students. In 2018 and 2019, a lot of registration happened for new freshmen during orientation so you can see in the blue and green lines that there are significant increases starting around week 24. Last year (and in 2021 as well) we did not see those increases as that process has changed and now freshmen are placed in blocks on a rolling basis as they are admitted, as you can see in the 2022 brown line. Our red line (2023) will follow this path, so now, the story is "slow and steady." There are smaller bumps and ridges in the trend lines, which will create momentary swings in our +/- counts and percentages when compared to the previous year, but for the most part, we should see more consistency from here on out.
Overall headcount, grad and undergrad, weeks 14-36 w/ COVID-19 years of 2020 and 2021 removed for readability
As I mentioned a couple of weeks ago, the little bump in the data last year at this time between weeks 18 and 19 dropped us behind a little but I thought we'd catch up in week 20 and that's exactly what happened. So, for overall enrollment, we are currently at -0.9% (-55, N=5,830). Last week we were down -1.8% compared to 2022, so this is a noticeable recovery. Additionally, for student credit hours and FTE, we are essentially running even with last year (see detailed counts below). UG New First-time Freshmen are still holding strong at +11.7% (+126, n=1,200) with active admits and orientation counts supporting that strength. UG Continuing are still running behind and will continue to, driven in large part by a large graduating class last year with preliminary counts showing the same for this year. We'll know more about those final degree completions in the coming weeks.
Next-term-registration rates are holding steady as well with every UG class running ahead of the last couple of years.
Baccalaureate "students with unfinished business" by class as of week 20
Overall UG persistence, seen below, across all classes and UG degree types, is running +1.5% over last year, and, if it holds steady, would put us at a recovery to pre-pandemic declines. We'll keep a close eye on this one and hope that it holds throughout the cycle.
Overall UG "students with unfinished business" as of week 20
A closer look at Fall 2023:
Undergraduate headcount compared to this week last fall:
• New Freshmen: +11.7% (+126, n=1,200)
• New Transfer: +3.3% (+3, n=94)
• Undergrad Readmits: -20.0% (-9, n=36)
• Postbaccalaureate: +8.6% (+3, n=38)
• Postbaccalaureate Reentry: 0.0% (0, n=1)
• Undergrad Nondegree: +30.8% (+4, n=17)
• Continuing Undergrad: -4.5% (-193, n=4,064)
• Undergraduate - Total: -1.2% (-66, n=5,450)
Graduate headcount:
• New Graduate: -13.1% (-11, n=73)
• Readmitted Grad: +25.0% (+1, n=5)
• Continuing Grad: +7.5% (+21, n=302)
• Graduate - Total: +3.0% (+11, n=380)
Overall headcount:
• Overall - Total Headcount: -0.9% (-55, n=5,830)
Student Credit Hours:
• Overall Student Credit Hours: 0.0% (+24.5, n=74,402)
Full-time Equivalent Students (FTE):
For FTE calcs, UG credit hours divide by 15 and graduate credit hours divided by 12
• Undergraduate FTE: -0.2% (-10.6, n=4,789.7)
• Graduate FTE: +7.7% (+15.3, n=213.0)
• Overall FTE: +0.1% (+4.7, n=5,002.7)
See this link for detailed Excel versions of reports.
Thank you,
Jason Nicholas
Assistant Provost and Director for Institutional Effectiveness
Northern Michigan University
1401 Presque Isle Ave
Marquette, MI 49855-5301
906-227-2379
nmu.edu/ie
IE Weekly Report - 5.5.23
IE Weekly Report - 5.5.23
*Note, figures displayed below include Global Campus counts unless otherwise noted.
Congratulations to all on another successful academic year!
As I alluded to last week, we are in the middle of a little bubble in last year's data that is making our counts look down further than I believe them to be. I'm going to hold off on too much speculation for a week or so until things recover. For now, I'll keep the update brief and just refer you to the actual numbers listed below for this week's report.
A closer look at Fall 2023:
Undergraduate headcount compared to this week last fall:
• New Freshmen: +6.3% (+65, n=1,093)
• New Transfer: +3.8% (+3, n=82)
• Undergrad Readmits: -25.6% (-11, n=32)
• Postbaccalaureate: +9.4% (+3, n=35)
• Postbaccalaureate Reentry: 0.0% (0, n=1)
• Undergrad Nondegree: +15.4% (+2, n=15)
• Continuing Undergrad: -4.3% (-180, n=4,049)
• Undergraduate - Total: -2.2% (-118, n=5,307)
Graduate headcount:
• New Graduate: -10.3% (-8, n=70)
• Readmitted Grad: +50.0% (+2, n=6)
• Continuing Grad: +7.1% (+19, n=286)
• Graduate - Total: +3.7% (+13, n=362)
Overall headcount:
• Overall - Total Headcount: -1.8% (-104, n=5,670)
Student Credit Hours:
• Overall Student Credit Hours: -0.9% (-627.5, n=72,294)
Full-time Equivalent Students (FTE):
For FTE calcs, UG credit hours divide by 15 and graduate credit hours divided by 12
• Undergraduate FTE: -1.2% (-55.8, n=4655.4)
• Graduate FTE: +8.9% (+16.8, n=204.5)
• Overall FTE: -0.8% (-38.5, n=4,860.5)
See this link for detailed Excel versions of reports.
Thank you,
Jason Nicholas
Assistant Provost and Director for Institutional Effectiveness
Northern Michigan University
1401 Presque Isle Ave
Marquette, MI 49855-5301
906-227-2379
nmu.edu/ie
IE Weekly Report - 4.28.23
IE Weekly Report - 4.28.23
*Note, figures displayed below include Global Campus counts unless otherwise noted.
Good morning,
As I alluded to last week, I was expecting we may slip back negative this week (-1.8%, -101, N=5,515 compared to week 18) as there was a brief bubble in last year's cycle between weeks 17 and 18 (which is where we are today). You can see it again in this chart which now includes this week's data. For reference, last week we were +0.6%, +34, N=5,335 when compared to week 17.
Overall headcount - week 17 (last week) and week 18 (this week) highlighted to show trend differences
Our 2023 trendline (red) kept on a steady march but didn't match the increases last year at this time. I can't find anything in my notes that explain that little bubble in 2022, but I expect that we'll catch up in about two weeks when the red and brown lines converge again. It's actually easier to see the trajectory of the cycle by taking out the 2021 and 2020 data where the pandemic broke the consistency of our admissions/enrollment cycle.
Overall headcount - 2020 and 2021 removed to highlight non-Covid years cycle behavior
Prior to 2022 (brown), new students were placed into blocks around orientation. Now, students are placed into blocks on a rolling basis which stabilizes the cycle. This is apparent when looking at the green (2018) and blue (2019) lines where obvious bumps/bubbles in the data around orientation (weeks 23-29) and makeup orientation (weeks 33, 34) show sizable increases. The brown line (2022) is much less noisy and hopefully, we'll be able to use that in the coming weeks to provide some good estimates of where we might be in Fall 2023.
A closer look at Fall 2023:
Undergraduate headcount compared to this week last fall:
• New Freshmen: +8.8% (+83, n=1021)
• New Transfer: +4.1% (+3, n=77)
• Undergrad Readmits: -29.3% (-12, n=29)
• Postbaccalaureate: +18.5% (+5, n=32)
• Postbaccalaureate Reentry: 0.0% (0, n=1)
• Undergrad Nondegree: 0.0% (0, n=12)
• Continuing Undergrad: -4.5% (-188, n=4005)
• Undergraduate - Total: -2.1% (-109, n=5177)
Graduate headcount:
• New Graduate: -12.7% (-9, n=62)
• Readmitted Grad: +100.0% (+3, n=6)
• Continuing Grad: +5.5% (+14, n=270)
• Graduate - Total: +2.4% (+8, n=338)
Overall headcount:
• Overall - Total Headcount: -1.8% (-101, n=5515)
Student Credit Hours:
• Overall Student Credit Hours: -1.2% (-851, n=70454)
Full-time Equivalent Students (FTE):
For FTE calcs, UG credit hours divide by 15 and graduate credit hours divided by 12
• Undergraduate FTE: -1.4% (-66.0, n=4545.1)
• Graduate FTE: 6.5% (11.5, n=189.8)
• Overall FTE: -1.1% (-54.4, n=4734.9)
Click Here for the Excel Report
IE Weekly Report - 4.21.23
IE Weekly Report - 4.21.23
*Note, figures displayed below include Global Campus counts unless otherwise noted.
Good morning,
Counts continued to improve a bit since last week. Currently, we are at +13.5% (+113, n=952) for New First-time Freshmen. Until orientation, it is hard to know how well these numbers will stick, but again, with orientation registrations and admits supporting the trend, a little bit of guarded optimism is in order. UG Transfers also are showing positive signs currently at +14.5% (+9, n=71) and UG Continuing held steady from last week at -3.0% (-121, n=3,931). Combined, Undergraduate populations are even with last year (yes, I checked the math!). Graduate populations are very similar to where they were last week.
Overall, we are currently +0.6% (+34, N=5,335). Last year, between weeks 17 and 18, though, there was a steep increase, so we may slip back negative next week unless we can match those gains in 2022.
Overall Headcount trends weeks 14-26, currently week 17; Red = 2023
Persistence numbers also crept up a bit. Again, just a reminder, think of these figures as the "unfinished business" students who aren't graduating and should be coming back. We have currently improved over the declines during the pandemic and will next be targeting recovery back to 2019 rates. I will continue to update these "re-enrollment" rates moving forward.
*Excludes those registered for graduation and, after the end of the semester, dismissed and suspended students
**Translated, this graph reads "Of the 4,418 students who should be re-enrolling to continue their education, 3,693 of them have registered for fall 2023. That equates to an 83.6% winter-to-fall persistence rate which is +1.1% better than in 2022."
A closer look at Fall 2023:
Undergraduate headcount compared to this week last fall:
• New Freshmen: +13.5% (+113, n=952)
• New Transfer: +14.5% (+9, n=71)
• Undergrad Readmits: -29.7% (-11, n=26)
• Postbaccalaureate: +11.5% (+3, n=29)
• Postbaccalaureate Reentry: 0.0% (0, n=1)
• Undergrad Nondegree: +233.3% (+7, n=10)
• Continuing Undergrad: -3.0% (-121, n=3,931)
• Undergraduate - Total: 0.0% (0, n=5,020)
Graduate headcount:
• New Graduate: -11.5% (-7, n=54)
• Readmitted Grad: +50.0% (+1, n=3)
• Continuing Grad: +18.3% (+40, n=258)
• Graduate - Total: +12.1% (+34, n=315)
Overall headcount:
• Overall - Total Headcount: +0.6% (+34, n=5,335)
Student Credit Hours:
• Overall Student Credit Hours: +0.1% (+67, n=68,452)
Full-time Equivalent Students (FTE):
For FTE calcs, UG credit hours divide by 15 and graduate credit hours divided by 12
• Undergraduate FTE: -0.1% (-6.5, n=4,420.2)
• Graduate FTE: +8.3% (+13.7, n=179.1)
• Overall FTE: +0.2% (+7.2, n=4,599.3)