Other Weekly Reports
IE Weekly Enrollment - Admissions Weekly Applications - Graduate Studies Weekly Enrollment
Global Campus Bi-Weekly Updates
Global Campus reporting contains both admission funnel reports (new students) and enrollment reports (new and continuing).
Global Campus reporting typically follows two main cycles per academic year:
- Fall terms will begin in April and run through the 10th-day count
- Winter term will begin in September and run through the 10th-day count.
- For each cycle, an end-of-term report may be posted reflecting student numbers that started at mid-semester.
*Note figures include all online undergraduate and graduate populations, including online international students, unless otherwise noted.
Summer/Fall 2024
Winter 2024
Fall 2023
Global Campus Fall 2023 Update - 8/25/23
8/25/23
Greetings,
*Note - figures below include all online undergraduate and graduate populations, including online international students, unless otherwise noted.
Fall 2023
The Global Campus is seeing significant growth from previous terms in its new incoming student population. This growth is due in part to the State of Michigan teacher prep initiatives Talent Together and Grow Your Own. There have been over 250 students admitted and enrolled over the last few weeks. Last week's special update highlighted these initiatives and their contribution. We’ll continue to register students through next week for the start of the semester. In addition, those students who are not able to be admitted by Tuesday they will be registered for the second half of the term.
The overall new and continuing enrollment is strong. The continuing student group for both undergraduates and graduate students is positive as well, with +13.5% (+22) and +12.7% (+25) respectively. The persistence of the continuing students is key to maintaining a positive trend.
Again, thank you to everyone for your continued support.
For your reference, follow this link for full fall 23 admission and enrollment reports.
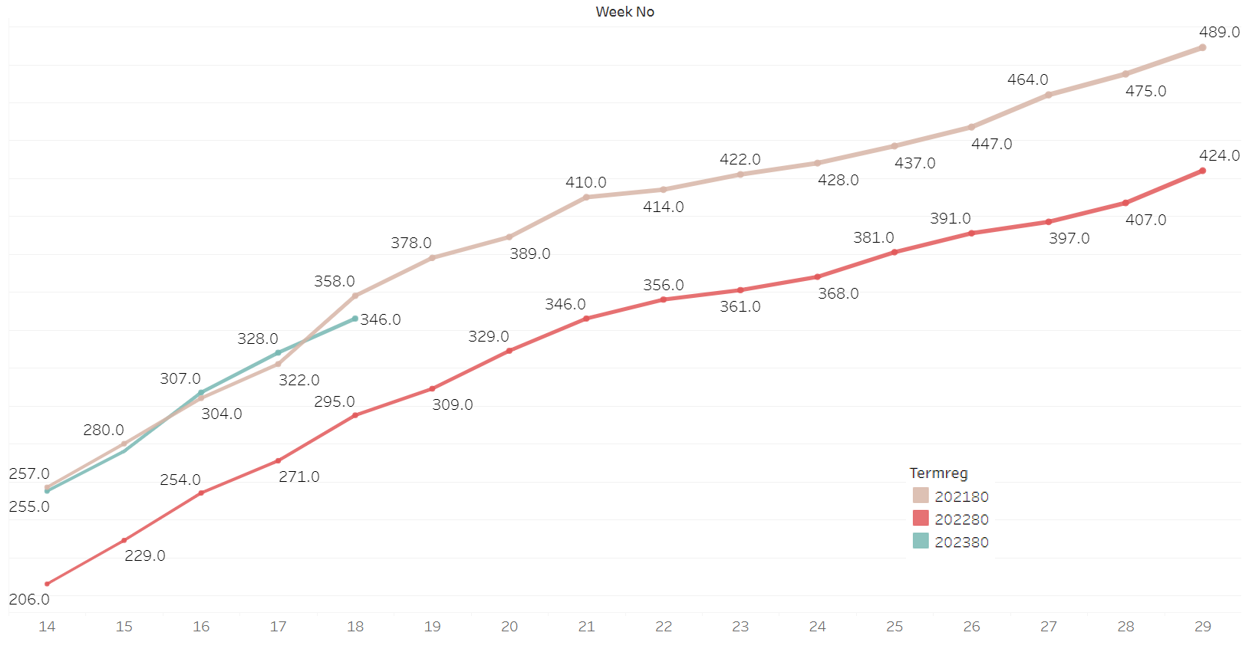
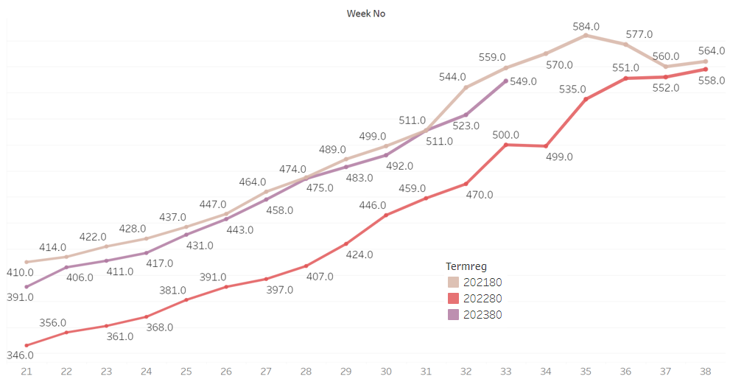
Fall 2023 New students - Application Funnel
Weekly highlights include:
- Application/enrollment funnel as of 7/27/23 to 8/24/23
- Applications moved from +59.2% (+343) to +57.7% (+357).
- Admitted students moved from +77.9% (+190) to +103.8% (+276).
- New student registration +1.4% (+2) to +119.7% (+188).
| Fall 23 ONL PROGRAMS APPLICATION FUNNEL | |||||||||||||||||||||||
| Apps | Apps | Apps | Apps | Active | Active | Active | Active | Enrolled | Enrolled | Enrolled | Enrolled | ||||||||||||
| Current | Last Yr | Diff | % Chg | Admits | Admits | Admits | Admits | Current | Last Yr | Diff | % Chg | ||||||||||||
| Current | Last Yr | Diff | % Chg | ||||||||||||||||||||
| Undergraduate | Subtotal | 708 | 456 | 252 | 55.3% | 370 | 171 | 199 | 116.4% | 220 | 79 | 141 | 178.5% | ||||||||||
| Graduate | Subtotal | 268 | 163 | 105 | 64.4% | 172 | 95 | 77 | 81.1% | 125 | 78 | 47 | 60.3% | ||||||||||
| Total | 976 | 619 | 357 | 57.7% | 542 | 266 | 276 | 103.8% | 345 | 157 | 188 | 119.7% | |||||||||||
| Run Date: Aug 24, 2023 "Active Admits" on this report includes only those still actively admitted (excluding those who have cancelled). | |||||||||||||||||||||||
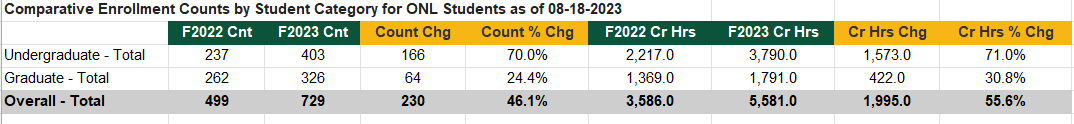
Fall 2023 Continuing and New Student Counts - Overall
Weekly highlights from 8/11/23 to 8/25/23:
- There will be enrollment fluctuations throughout the summer months.
- Overall headcount moved from +9.8% (+49) to +44.5% (+238).
- Overall credit hours moved from +20.3% (+730) to +54.4% (+2,070).
| Comparative Enrollment Counts by Student Category for ONL Students as of 08-25-2023 | ||||||||
| F2022 Cnt | F2023 Cnt | Count Chg | Count % Chg | F2022 Cr Hrs | F2023 Cr Hrs | Cr Hrs Chg | Cr Hrs % Chg | |
| Undergraduate - Total | 252 | 421 | 169 | 67.1% | 2,358.0 | 3,944.0 | 1,586.0 | 67.3% |
| Graduate - Total | 283 | 352 | 69 | 24.4% | 1,446.0 | 1,930.0 | 484.0 | 33.5% |
| Overall - Total | 535 | 773 | 238 | 44.5% | 3,804.0 | 5,874.0 | 2,070.0 | 54.4% |
Global Campus Fall 2023 Update - 8/18/23
8/18/23
This is a quick note regarding many people's excellent work during the last few weeks. Over 250 NEW Global Campus students have been admitted and enrolled for the fall term this past week. Most of the new students are part of the Talent Together (TT) and Grow Your Own (GYO) initiatives for teacher prep in Michigan. All the TT and GYO students are enrolled in NMU programs offered through the School of Education, Leadership, and Public Service (SELPS). In addition, there are also another 50 more potential students we are trying to work through the system before the start of the semester.
That said, the Global Campus is currently at +46.1% (+230) headcount for Fall 23, for an n=729.
Those gains pushed the institution to +2.6% (+182) headcount for Fall 23, for an n=7,089.
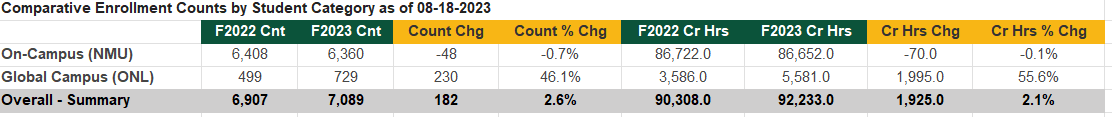
Full reports can be seen here.
This extraordinary work was accomplished quickly by the great teams across campus, including SELPS, the Global Campus team, the Admissions staff, and the Graduate Office. The TT and GYO participants will be with NMU for at least two years as they work through their programs. So, the work is not over. We'll be working hard to keep these students engaged and persisting.
With the fall term just over a week away, it looks hopeful that NMU will see a positive overall enrollment and incoming class for Fall 23.
Feel free to contact me or Jason Nicholas with any questions or concerns about the numbers.
Thanks again to everyone who pulled this off.
Global Campus Fall 2023 Update - 8/11/23
8/11/23
Greetings,
*Note figures below include all online undergraduate and graduate populations, including online international students, unless otherwise noted.
Fall 2023
The top of the admission funnel has again made significant gains over the last two weeks. Grow Your Own & Talent Together initiatives are the bulk of gains. Social Work (BSW), Management, and Cannabis/Plant Based Wellness Operations have seen great interest. The Global Campus staff are working diligently to get the new admits enrolled. Our communication is ramping up as we approach the start of the semester. The challenge lies in finding open spots in online courses.
The overall Global Campus population, including new and continuing students, continued to make gains. However, there was a slight drop in comparative weeks. We are starting to push a bit harder on the new and continuing not enrolled student populations.
Again, thank you to everyone for your continued support.
For your reference, follow this link for full Fall 23 admission and enrollment reports.
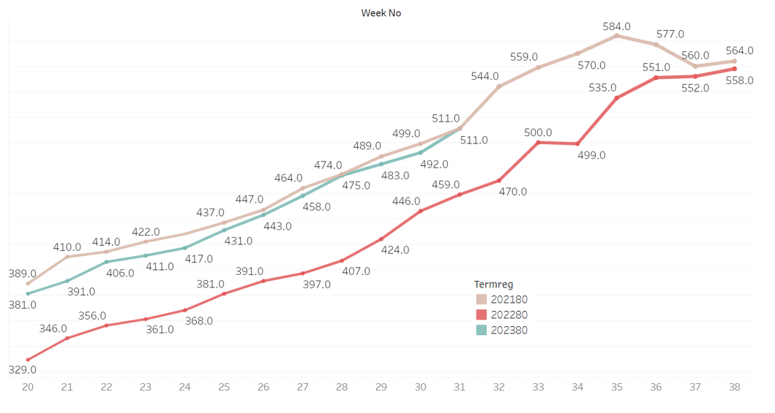
Fall 2023 New students - Application Funnel
Weekly highlights include:
- Application/enrollment funnel as of 7/27/23 to 8/10/23
- Applications moved from +34.9% (+188) to +59.2% (+343).
- Admitted students moved from +24% (+54) to +77.9% (+190).
- New student registration -5.5% (-7) to +1.4% (+2).
|
Fall 23 ONL PROGRAMS APPLICATION FUNNEL |
|||||||||||||
|
Apps |
Apps |
Apps |
Apps |
Active |
Active |
Active |
Active |
Enrolled |
Enrolled |
Enrolled |
Enrolled |
||
|
Current |
Last Yr |
Diff |
% Chg |
Admits |
Admits |
Admits |
Admits |
Current |
Last Yr |
Diff |
% Chg |
||
|
|
|
|
|
Current |
Last Yr |
Diff |
% Chg |
|
|
|
|
||
|
Undergraduate |
Subtotal |
670 |
435 |
235 |
54.0% |
326 |
161 |
165 |
102.5% |
88 |
76 |
12 |
15.8% |
|
Graduate |
Subtotal |
252 |
144 |
108 |
75.0% |
108 |
83 |
25 |
30.1% |
55 |
65 |
-10 |
-15.4% |
|
Total |
|
922 |
579 |
343 |
59.2% |
434 |
244 |
190 |
77.9% |
143 |
141 |
2 |
1.4% |
|
Run Date: Aug 10, 2023 "Active Admits" on this report includes only those still actively admitted (excluding those who have cancelled). |
|||||||||||||
Fall 2023 Continuing and New Student Counts - Overall
Weekly highlights from 7/28/23 to 8/11/23:
- There will be enrollment fluctuations throughout the summer months.
- Overall headcount moved from +11.3% (+52) to +9.8% (+49).
- Overall credit hours moved from +17.4% (+596) to +20.3% (+730).
|
Comparative Enrollment Counts by Student Category for ONL Students as of 08-11-2023 |
||||||||
|
|
F2022 Cnt |
F2023 Cnt |
Count Chg |
Count % Chg |
F2022 Cr Hrs |
F2023 Cr Hrs |
Cr Hrs Chg |
Cr Hrs % Chg |
|
Undergraduate - Total |
240 |
279 |
39 |
16.3% |
2,221.0 |
2,755.0 |
534.0 |
24.0% |
|
Graduate - Total |
260 |
270 |
10 |
3.8% |
1,368.0 |
1,564.0 |
196.0 |
14.3% |
|
Overall - Total |
500 |
549 |
49 |
9.8% |
3,589.0 |
4,319.0 |
730.0 |
20.3% |
Global Campus Fall 2023 Update - 7/28/23
7/28/23
Greetings,
*Note figures below include all online undergraduate and graduate populations, including online international students, unless otherwise noted.
Fall 2023
The top of the admission funnel had significant gains over the last two weeks. The gains are due to, in part, the K-12 teacher initiatives (Grow Your Own & Talent Together). That admits are working through the admission process and will be enrolling over the next couple of weeks. The new student enrollment comparative numbers are expected to rebound as we register that group.
The overall Global Campus population, including new and continuing students, continued to make gains. However, there was a slight drop in comparative weeks. We are starting to push a bit harder on the new and continuing not enrolled students populations.
Again, thank you to everyone for your continued support.
For your reference, follow this link for full summer and fall 23 admission and enrollment reports.
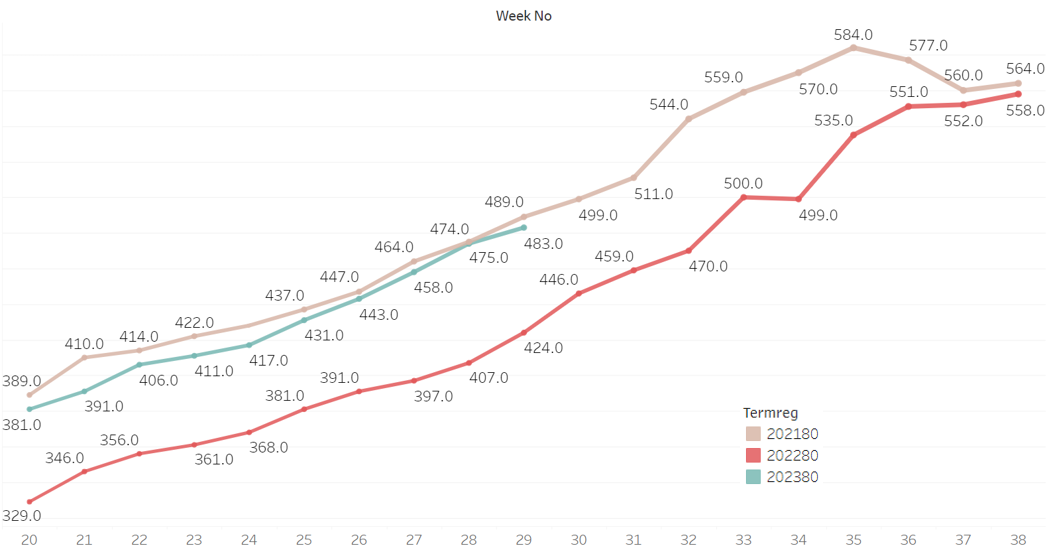
Fall 2023 New students - Application Funnel
Weekly highlights include:
- Application/enrollment funnel as of 7/13/23 to 7/27/23
- Applications moved from +16.4% (+81) to +34.9% (+188).
- Admitted students moved from +11.8% (+25) to +24% (+54).
- New student registration +6.1% (+6) to -5.5% (-7).
|
Fall 23 ONL PROGRAMS APPLICATION FUNNEL |
||||||||||||
|
Apps |
Apps |
Apps |
Apps |
Active |
Active |
Active |
Active |
Enrolled |
Enrolled |
Enrolled |
Enrolled |
|
|
Current |
Last Yr |
Diff |
% Chg |
Admits |
Admits |
Admits |
Admits |
Current |
Last Yr |
Diff |
% Chg |
|
|
|
|
|
|
Current |
Last Yr |
Diff |
% Chg |
|
|
|
|
|
|
Undergraduate |
539 |
404 |
135 |
33.4% |
203 |
153 |
50 |
32.7% |
73 |
74 |
-1 |
-1.4% |
|
Graduate |
187 |
134 |
53 |
39.6% |
76 |
72 |
4 |
5.6% |
47 |
53 |
-6 |
-11.3% |
|
Total |
726 |
538 |
188 |
34.9% |
279 |
225 |
54 |
24.0% |
120 |
127 |
-7 |
-5.5% |
|
Run Date: Jul 27, 2023 "Active Admits" on this report includes only those still actively admitted (excluding those who have cancelled). |
||||||||||||
Fall 2023 Continuing and New Student Counts - Overall
Weekly highlights from 7/14/23 to 7/28/23:
- There will be enrollment fluctuations throughout the summer months.
- Overall headcount moved from +13.9% (+59) to +11.3% (+52).
- Overall credit hours moved from +15.4 (+495) to +17.4% (+596).
|
Comparative Enrollment Counts by Student Category for ONL Students as of 07-28-2023 |
||||||||
|
|
F2022 Cnt |
F2023 Cnt |
Count Chg |
Count % Chg |
F2022 Cr Hrs |
F2023 Cr Hrs |
Cr Hrs Chg |
Cr Hrs % Chg |
|
Undergraduate - Total |
233 |
262 |
29 |
12.4% |
2,163.0 |
2,566.0 |
403.0 |
18.6% |
|
Graduate - Total |
226 |
249 |
23 |
10.2% |
1,262.0 |
1,455.0 |
193.0 |
15.3% |
|
Overall - Total |
459 |
511 |
52 |
11.3% |
3,425.0 |
4,021.0 |
596.0 |
17.4% |
Global Campus Summer/Fall 2023 Update - 7/14/23
7/14/23
Greetings,
*Note figures below include all online undergraduate and graduate populations, including online international students, unless otherwise noted.
Fall 2023
The top of the funnel had some good gains over the last couple of weeks. This is partially due to the elimination of the admissions application fee. Gerri Daniels stated in her report, “This jump is largely due to the completion of applications due to the removal of the application fee requirement as of July 1. We were therefore able to make admission decisions on those files that had the academic information necessary for a decision. Others are receiving communication about the policy change and are invited to provide the remaining information necessary for a decision.” The new student enrollment is still strong. However, there was a drop in comparative week numbers. But we expect that to pick up with the gains at the top of the funnel.
The overall Global Campus population, including new and continuing students, continued to make gains. However, there was a slight drop in comparative weeks. We are moving into the busiest time for distance education. We’ll see 50% of our admits during this period working up to the fall start.
Again, thank you to everyone for your continued support.
For your reference, follow this link for full summer and fall 23 admission and enrollment reports.
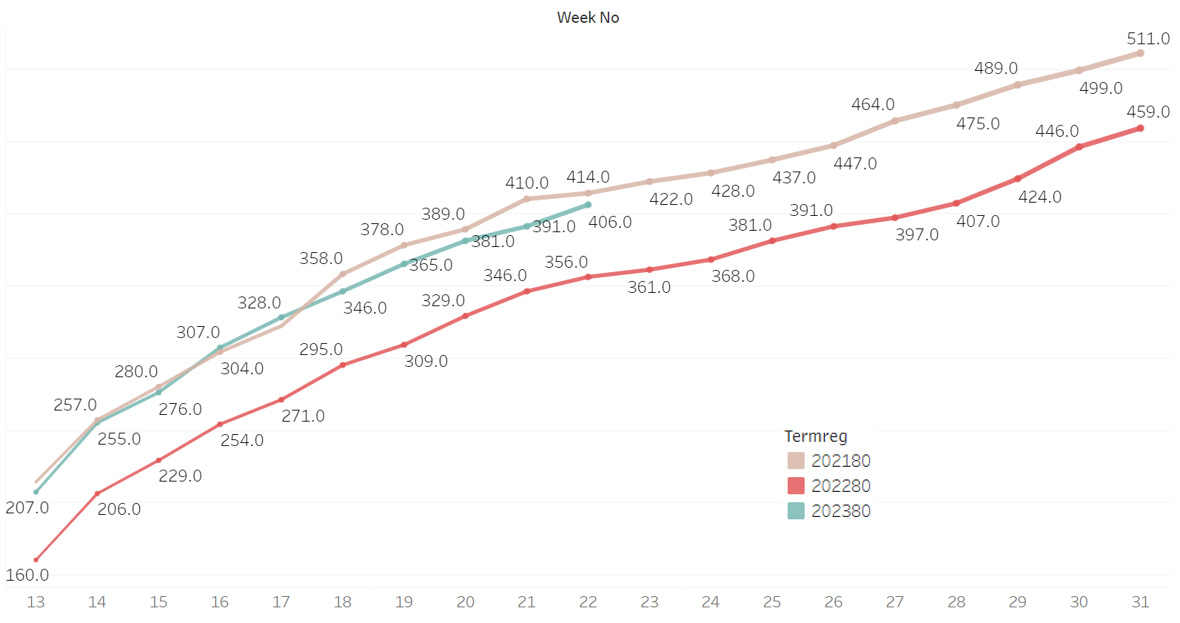
Fall 2023 New students - Application Funnel
Weekly highlights include:
- Application/enrollment funnel as of 6/29/23 to 7/13/23
- Applications moved from +13.5% (+63) to +16.4% (+81).
- Admitted students moved from +6.7% (+13) to +11.8% (+25).
- New student registration +10.7% (+9) to +6.1% (+6).
|
Fall 23 ONL PROGRAMS APPLICATION FUNNEL |
|||||||||||||
|
Apps |
Apps |
Apps |
Apps |
Active |
Active |
Active |
Active |
Enrolled |
Enrolled |
Enrolled |
Enrolled |
||
|
Current |
Last Yr |
Diff |
% Chg |
Admits |
Admits |
Admits |
Admits |
Current |
Last Yr |
Diff |
% Chg |
||
|
|
|
|
|
Current |
Last Yr |
Diff |
% Chg |
|
|
|
|
||
|
Undergraduate |
Subtotal |
438 |
374 |
64 |
17.1% |
173 |
149 |
24 |
16.1% |
62 |
57 |
5 |
8.8% |
|
Graduate |
Subtotal |
138 |
121 |
17 |
14.0% |
64 |
63 |
1 |
1.6% |
42 |
41 |
1 |
2.4% |
|
Total |
|
576 |
495 |
81 |
16.4% |
237 |
212 |
25 |
11.8% |
104 |
98 |
6 |
6.1% |
|
Run Date: Jul 13, 2023 "Active Admits" on this report includes only those still actively admitted (excluding those who have cancelled). |
|||||||||||||
Fall 2023 Continuing and New Student Counts - Overall
Weekly highlights from 6/30/23 to 7/14/23:
- There will be enrollment fluctuations throughout the summer months.
- Overall headcount moved from +15.4% (+61) to +13.9% (+59).
- Overall credit hours moved from +17.8% (+540) to +15.4 (+495).
|
Comparative Enrollment Counts by Student Category for ONL Students as of 07-14-2023 |
||||||||
|
|
F2022 Cnt |
F2023 Cnt |
Count Chg |
Count % Chg |
F2022 Cr Hrs |
F2023 Cr Hrs |
Cr Hrs Chg |
Cr Hrs % Chg |
|
Undergraduate - Total |
213 |
245 |
32 |
15.0% |
2,017.0 |
2,323.0 |
306.0 |
15.2% |
|
Graduate - Total |
211 |
238 |
27 |
12.8% |
1,207.0 |
1,396.0 |
189.0 |
15.7% |
|
Overall - Total |
424 |
483 |
59 |
13.9% |
3,224.0 |
3,719.0 |
495.0 |
15.4% |
Global Campus Summer/Fall 2023 Update - 6/30/23
Greetings,
*Note figures below include all online undergraduate and graduate populations, including online international students, unless otherwise noted.
Fall 2023
There have been decent gains across the entire admissions funnel over the last couple of weeks. There are no significant outliers in movement among departments or programs. However, Social Work continues to be strong at both the undergraduate and graduate levels. Undergraduate application fees are being discontinued as of this week. On 6/30, all applications with outstanding fees will automatically be waived and marked as complete and processed as appropriate. This will cause a spike in admits. The goal is to target this population, welcoming them to NMU and encouraging enrollment.
The overall Global Campus population, including new and continuing students, continued to make gains. We’ll have to see how the holiday period plays a role in enrollments. We are moving into the busiest time for distance education. We’ll see 50% of our admits during this period working up to the fall start.
Again, thank you to everyone for your continued support.
For your reference, follow this link for full summer and fall 23 admission and enrollment reports.
Fall 2023 New students - Application Funnel
Weekly highlights include:
- Application/enrollment funnel as of 6/15/23 to 6/29/23
- Applications moved from +9.3% (+42) to +13.5% (+63).
- Admitted students moved from +4% (+7) to +6.7% (+13.
- New student registration +9.1% (+7) to +10.7% (+9).
|
Fall 23 ONL PROGRAMS APPLICATION FUNNEL |
|||||||||||||
|
Apps |
Apps |
Apps |
Apps |
Active |
Active |
Active |
Active |
Enrolled |
Enrolled |
Enrolled |
Enrolled |
||
|
Current |
Last Yr |
Diff |
% Chg |
Admits |
Admits |
Admits |
Admits |
Current |
Last Yr |
Diff |
% Chg |
||
|
|
|
|
|
Current |
Last Yr |
Diff |
% Chg |
|
|
|
|
||
|
Undergraduate |
Subtotal |
398 |
355 |
43 |
12.1% |
144 |
136 |
8 |
5.9% |
53 |
49 |
4 |
8.2% |
|
Graduate |
Subtotal |
132 |
112 |
20 |
17.9% |
62 |
57 |
5 |
8.8% |
40 |
35 |
5 |
14.3% |
|
Total |
|
530 |
467 |
63 |
13.5% |
206 |
193 |
13 |
6.7% |
93 |
84 |
9 |
10.7% |
|
Run Date: Jun 29, 2023 "Active Admits" on this report includes only those still actively admitted (excluding those who have cancelled). |
|||||||||||||
Fall 2023 Continuing and New Student Counts - Overall
Weekly highlights from 6/16/23 to 6/30/23:
- There will be enrollment fluctuations throughout the summer months.
- Overall headcount moved from +13.1 (+50) to +15.4% (+61).
- Overall credit hours moved from +17.5% (+504) to +17.8% (+540).
|
Comparative Enrollment Counts by Student Category for ONL Students as of 06-30-2023 |
||||||||
|
|
F2022 Cnt |
F2023 Cnt |
Count Chg |
Count % Chg |
F2022 Cr Hrs |
F2023 Cr Hrs |
Cr Hrs Chg |
Cr Hrs % Chg |
|
Undergraduate - Total |
201 |
230 |
29 |
14.4% |
1,905.0 |
2,213.0 |
308.0 |
16.2% |
|
Graduate - Total |
196 |
228 |
32 |
16.3% |
1,123.0 |
1,355.0 |
232.0 |
20.7% |
|
Overall - Total |
397 |
458 |
61 |
15.4% |
3,028.0 |
3,568.0 |
540.0 |
17.8% |

Global Campus Summer/Fall 2023 Update - 6/26/23
6/16/23
Greetings,
*Note figures below include all online undergraduate and graduate populations, including online international students, unless otherwise noted.
Fall 2023
The overall enrollment funnel has remained relatively stable over the last few weeks. Two graduate programs that are seeing good gains are Social Work and Early Childhood Education. Social Work has also added the bachelor's program as a Global Campus option for the fall. There has been good interest in the undergraduate program, which will also help the MSW.
The overall Global Campus population, including new and continuing students, cooled slightly. We expect the term-to-term weekly comparisons to continue to decline slightly. On a positive note, continuing students commit to the fall term earlier. Overall numbers are still expected to be positive for the fall.
Again, thank you to everyone for your continued support.
For your reference, follow this link for full summer and fall 23 admission and enrollment reports.
Fall 2023 New students - Application Funnel
Weekly highlights include:
- Application/enrollment funnel as of 5/25/23 to 6/15/23
- Applications moved from +9.2% (+36) to +9.3% (+42).
- Admitted students moved from +5.3 (+8) to +4% (+7).
- New student registration +9.5% (+6) to +9.1% (+7).
|
Fall 23 ONL PROGRAMS APPLICATION FUNNEL |
Apps |
Apps |
Apps |
Apps |
Active |
Active |
Active |
Active |
Enrolled |
Enrolled |
Enrolled |
Enrolled |
|
|
Current |
Last Yr |
Diff |
% Chg |
Admits |
Admits |
Admits |
Admits |
Current |
Last Yr |
Diff |
% Chg |
||
|
|
|
|
|
Current |
Last Yr |
Diff |
% Chg |
|
|
|
|
||
|
Undergraduate |
Subtotal |
356 |
330 |
26 |
7.9% |
121 |
121 |
0 |
0.0% |
45 |
45 |
0 |
0.0% |
|
Graduate |
Subtotal |
124 |
108 |
16 |
14.8% |
59 |
52 |
7 |
13.5% |
39 |
32 |
7 |
21.9% |
|
Total |
|
480 |
438 |
42 |
9.6% |
180 |
173 |
7 |
4.0% |
84 |
77 |
7 |
9.1% |
|
Run Date: Jun 15, 2023 "Active Admits" on this report includes only those still actively admitted (excluding those who have cancelled). |
|||||||||||||
Fall 2023 Continuing and New Student Counts - Overall
Weekly highlights from 5/26/23 to 6/16/23:
- There will be enrollment fluctuations throughout the summer months.
- Overall headcount moved from +14% (+50) to +13.1 (+50).
- Overall credit hours moved from +20.1% (+532) to +17.5% (+504).
|
Comparative Enrollment Counts by Student Category for ONL Students as of 06-16-2023 |
||||||||
|
|
F2022 Cnt |
F2023 Cnt |
Count Chg |
Count % Chg |
F2022 Cr Hrs |
F2023 Cr Hrs |
Cr Hrs Chg |
Cr Hrs % Chg |
|
Undergraduate - Total |
197 |
213 |
16 |
8.1% |
1,835.0 |
2,066.0 |
231.0 |
12.6% |
|
Graduate - Total |
184 |
218 |
34 |
18.5% |
1,046.0 |
1,319.0 |
273.0 |
26.1% |
|
Overall - Total |
381 |
431 |
50 |
13.1% |
2,881.0 |
3,385.0 |
504.0 |
17.5% |
Global Campus Summer/Fall 2023 Update - 5/26/23
5/26/23
Greetings,
*Note figures below include all online undergraduate and graduate populations, including online international students, unless otherwise noted.
Summer 2023
This will be the last update for the summer term. However, there will still be new admissions and enrollments throughout the summer for the second half and the other non-traditional course start dates. Summer has seen some significant gains over the last year at this time. New student enrollment numbers have almost doubled, and the funnel was significantly positive across each stage. We will be connecting with the admits that did not register and no-shows to talk about updating their start term to the fall semester.
Summer 2023 New students - Application Funnel
| Summer 23 ONL PROGRAMS APPLICATION FUNNEL | Apps | Apps | Active | Active | Enrolled | Enrolled | |
| Diff | % Chg | Admits | Admits | Diff | % Chg | ||
| Diff | % Chg | ||||||
| Overall Total | 93 | 39.2% | 53 | 46.9% | 30 | 44.8% | |
| Run Date: May 25, 2023 "Active Admits" on this report includes only those still actively admitted (excluding those who have cancelled). | |||||||
Summer 2023 Continuing and New Student Counts - Overall
| Comparative Enrollment Counts by Student Category for ONL Students as of 05-26-2023 | ||||
| Count Chg | Count % Chg | Cr Hrs Chg | Cr Hrs % Chg | |
| Overall - Total | 45 | 12.7% | 312.0 | 15.2% |
Fall 2023
The wave continues to move through the admission funnel for fall, as there were a couple of point gains in new enrollments. Apps and admits dropped a bit. However, there will be some rebounding in the coming months. The Global Campus sees 50% of our applicants within two months of the student's intended start term. July and August will be a busy time.
The overall enrollment, including new and continuing, is still relatively steady. There was a slight drop in headcount. However, there was a slight gain in credit hours. We are still focusing on the continuing student not yet enrolled lists and reaching out to those students in multiple ways.
Again thank you to everyone for your continued support.
Follow this link for full summer and fall 23 admission and enrollment reports for your reference.
Fall 2023 New students - Application Funnel
Weekly highlights include:
- Application/enrollment funnel as of 5/11/23 to 5/25/23
- Applications moved from +13.5% (+47) to +9.2% (+36).
- Admitted students moved from +5.8% (+8) to +5.3 (+8).
- New student registration +7.8% (+4) to +9.5% (+6).
| Fall 23 ONL PROGRAMS APPLICATION FUNNEL | Apps | Apps | Apps | Apps | Active | Active | Active | Active | Enrolled | Enrolled | Enrolled | Enrolled | |
| Current | Last Yr | Diff | % Chg | Admits | Admits | Admits | Admits | Current | Last Yr | Diff | % Chg | ||
| Current | Last Yr | Diff | % Chg | ||||||||||
| Undergraduate | Subtotal | 315 | 294 | 21 | 7.1% | 106 | 105 | 1 | 1.0% | 37 | 35 | 2 | 5.7% |
| Graduate | Subtotal | 114 | 99 | 15 | 15.2% | 52 | 45 | 7 | 15.6% | 32 | 28 | 4 | 14.3% |
| Total | 429 | 393 | 36 | 9.2% | 158 | 150 | 8 | 5.3% | 69 | 63 | 6 | 9.5% | |
| Run Date: May 25, 2023 "Active Admits" on this report includes only those still actively admitted (excluding those who have cancelled). | |||||||||||||
Fall 2023 Continuing and New Student Counts - Overall
Weekly highlights from 5/12/23 to 5/26/23:
- There will be enrollment fluctuations throughout the summer months.
- Overall headcount moved from +15.8 (+52) to +14% (+50).
- Overall credit hours moved from +19.5 (+477) to +20.1% (+532).
| Comparative Enrollment Counts by Student Category for ONL Students as of 05-26-2023 | ||||||||
| F2022 Cnt | F2023 Cnt | Count Chg | Count % Chg | F2022 Cr Hrs | F2023 Cr Hrs | Cr Hrs Chg | Cr Hrs % Chg | |
| Undergraduate - Total | 184 | 197 | 13 | 7.1% | 1,672.0 | 1,911.0 | 239.0 | 14.3% |
| Graduate - Total | 172 | 209 | 37 | 21.5% | 981.0 | 1,274.0 | 293.0 | 29.9% |
| Overall - Total | 356 | 406 | 50 | 14.0% | 2,653.0 | 3,185.0 | 532.0 | 20.1% |
Global Campus Summer/Fall 2023 Update - 5/12/23
5/12/23
*Note figures below include all online undergraduate and graduate populations, including online international students, unless otherwise noted.
Greetings,
As expected, the Fall 23 admission funnel is growing in stages or waves as applicants move through the process. Apps are up 1.5% and admits are up 2.5%. Now we'll be working on the matriculation of those new admits. We continue to adjust our program-specific marketing based on performance and trends.
The overall enrollment, including new and continuing students, has remained steady. There was a small dip in headcount, while there was a slight increase in credit hours. We are focusing on the continuing student not yet enrolled lists and reaching out to those students in multiple ways.
Here is a brief highlight of summer's impact on the Global Campus population. Summer is a significant term for distance education, particularly for the professions that slow down during those months, like education. There has been a significant increase in our summer counts. Both undergrad and graduate levels are positive. However, the most significant percentage growth is in the graduate Education and Social Work programs.
Summer 2023 New students - Application Funnel
| Summer 23 ONL PROGRAMS APPLICATION FUNNEL | Apps | Apps | Active | Active | Enrolled | Enrolled | |
| Diff | % Chg | Admits | Admits | Diff | % Chg | ||
| Diff | % Chg | ||||||
| Total | 84 | 36.7% | 49 | 45.4% | 25 | 41.7% | |
| Run Date: May 11, 2023 "Active Admits" on this report includes only those still actively admitted (excluding those who have cancelled). | |||||||
Summer 2023 Continuing and New Student Counts - Overall
| Comparative Enrollment Counts by Student Category for ONL Students as of 05-12-2023 | ||||
| Count Chg | Count % Chg | Cr Hrs Chg | Cr Hrs % Chg | |
| Overall - Total | 40 | 11.8% | 306.0 | 15.4% |
Again thank you to everyone for your continued support.
Follow this link for full summer and fall 23 admission and enrollment reports for your reference.
Fall 2023 New students - Application Funnel
Weekly highlights include:
- Application/enrollment funnel as of 4/27/23 to 5/11/23
- Applications moved from +12.1% (+39) to +13.5% (+47).
- Admitted students moved from +3.3% (+4) to +5.8% (+8).
- New student registration +21.6% (+8) to +7.8% (+4).
| Fall 23 ONL PROGRAMS APPLICATION FUNNEL | Apps | Apps | Apps | Apps | Active | Active | Active | Active | Enrolled | Enrolled | Enrolled | Enrolled | |
| Current | Last Yr | Diff | % Chg | Admits | Admits | Admits | Admits | Current | Last Yr | Diff | % Chg | ||
| Current | Last Yr | Diff | % Chg | ||||||||||
| Undergraduate | Subtotal | 291 | 259 | 32 | 12.4% | 101 | 94 | 7 | 7.4% | 32 | 29 | 3 | 10.3% |
| Graduate | Subtotal | 103 | 88 | 15 | 17.0% | 45 | 44 | 1 | 2.3% | 23 | 22 | 1 | 4.5% |
| Total | 394 | 347 | 47 | 13.5% | 146 | 138 | 8 | 5.8% | 55 | 51 | 4 | 7.8% | |
| Run Date: May 11, 2023 "Active Admits" on this report includes only those still actively admitted (excluding those who have cancelled). | |||||||||||||
Fall 2023 Continuing and New Student Counts - Overall
Weekly highlights from 4/28/23 to 5/12/23:
- There will be enrollment fluctuations throughout the summer months.
- Overall headcount moved from +17.3% (+51) to +15.8 (+52).
- Overall credit hours moved from +19.2% (+426) to +19.5 (+477).
| Comparative Enrollment Counts by Student Category for ONL Students as of 05-12-2023 | ||||||||
| F2022 Cnt | F2023 Cnt | Count Chg | Count % Chg | F2022 Cr Hrs | F2023 Cr Hrs | Cr Hrs Chg | Cr Hrs % Chg | |
| Undergraduate - Total | 169 | 183 | 14 | 8.3% | 1,557.0 | 1,747.0 | 190.0 | 12.2% |
| Graduate - Total | 160 | 198 | 38 | 23.8% | 893.0 | 1,180.0 | 287.0 | 32.1% |
| Overall - Total | 329 | 381 | 52 | 15.8% | 2,450.0 | 2,927.0 | 477.0 | 19.5% |
Global Campus Summer/Fall 2023 Update - 4/28/23
4/28/23
Greetings,
*Note figures below include all online undergraduate and graduate populations, including online international students, unless otherwise noted.
The application funnel made some gains over the last couple of weeks in terms of new applications and new enrollments. Admits did decline slightly. However, with the application gains, admit should catch up as apps are processed. Additionally, summer new student enrollments are helping keep the overall number for fall strong.
As expected, the fall's overall enrollment (new and continuing) has slowed a bit. The early registrations of continuing students are a win, as they have a better chance of getting into the courses they need. As the weeks go by, comparative numbers will continue to get closer. However, most indicators show that the fall semester will remain on the positive side.
Again thank you to everyone for your continued support.
Follow this link for full summer and fall 23 admission and enrollment reports for your reference.
Fall 2023 New students - Application Funnel
Weekly highlights include:
- Application/enrollment funnel as of 4/13/23 to 4/27/23
- Applications moved from +11.7% (+35) to +12.1% (+39).
- Admitted students moved from +6.6% (+7) to +3.3% (+4).
- New student registration +12.5% (+4) to +21.6% (+8).
| Fall 23 ONL PROGRAMS APPLICATION FUNNEL | Apps | Apps | Apps | Apps | Active | Active | Active | Active | Enrolled | Enrolled | Enrolled | Enrolled | |
| Current | Last Yr | Diff | % Chg | Admits | Admits | Admits | Admits | Current | Last Yr | Diff | % Chg | ||
| Current | Last Yr | Diff | % Chg | ||||||||||
| Undergraduate | Subtotal | 269 | 242 | 27 | 11.2% | 91 | 85 | 6 | 7.1% | 28 | 23 | 5 | 21.7% |
| Graduate | Subtotal | 92 | 80 | 12 | 15.0% | 36 | 38 | -2 | -5.3% | 17 | 14 | 3 | 21.4% |
| Total | 361 | 322 | 39 | 12.1% | 127 | 123 | 4 | 3.3% | 45 | 37 | 8 | 21.6% | |
| Run Date: Apr 27, 2023 "Active Admits" on this report includes only those still actively admitted (excluding those who have cancelled). | |||||||||||||
Fall 2023 Continuing and New Student Counts - Overall
Weekly highlights from 4/14/23 to 4/28/23:
- There will be enrollment fluctuations throughout the summer months.
- Overall headcount moved from +20.9% (+53) to +17.3% (+51).
- Overall credit hours moved from +22.6% (+431) to +19.2% (+426).
| Comparative Enrollment Counts by Student Category for ONL Students as of 04-28-2023 | ||||||||
| F2022 Cnt | F2023 Cnt | Count Chg | Count % Chg | F2022 Cr Hrs | F2023 Cr Hrs | Cr Hrs Chg | Cr Hrs % Chg | |
| Undergraduate - Total | 158 | 172 | 14 | 8.9% | 1,450.0 | 1,625.0 | 175.0 | 12.1% |
| Graduate - Total | 137 | 174 | 37 | 27.0% | 773.0 | 1,024.0 | 251.0 | 32.5% |
| Overall - Total | 295 | 346 | 51 | 17.3% | 2,223.0 | 2,649.0 | 426.0 | 19.2% |